Source page: McKinsey & Company
Commentary
Running hot
Economy
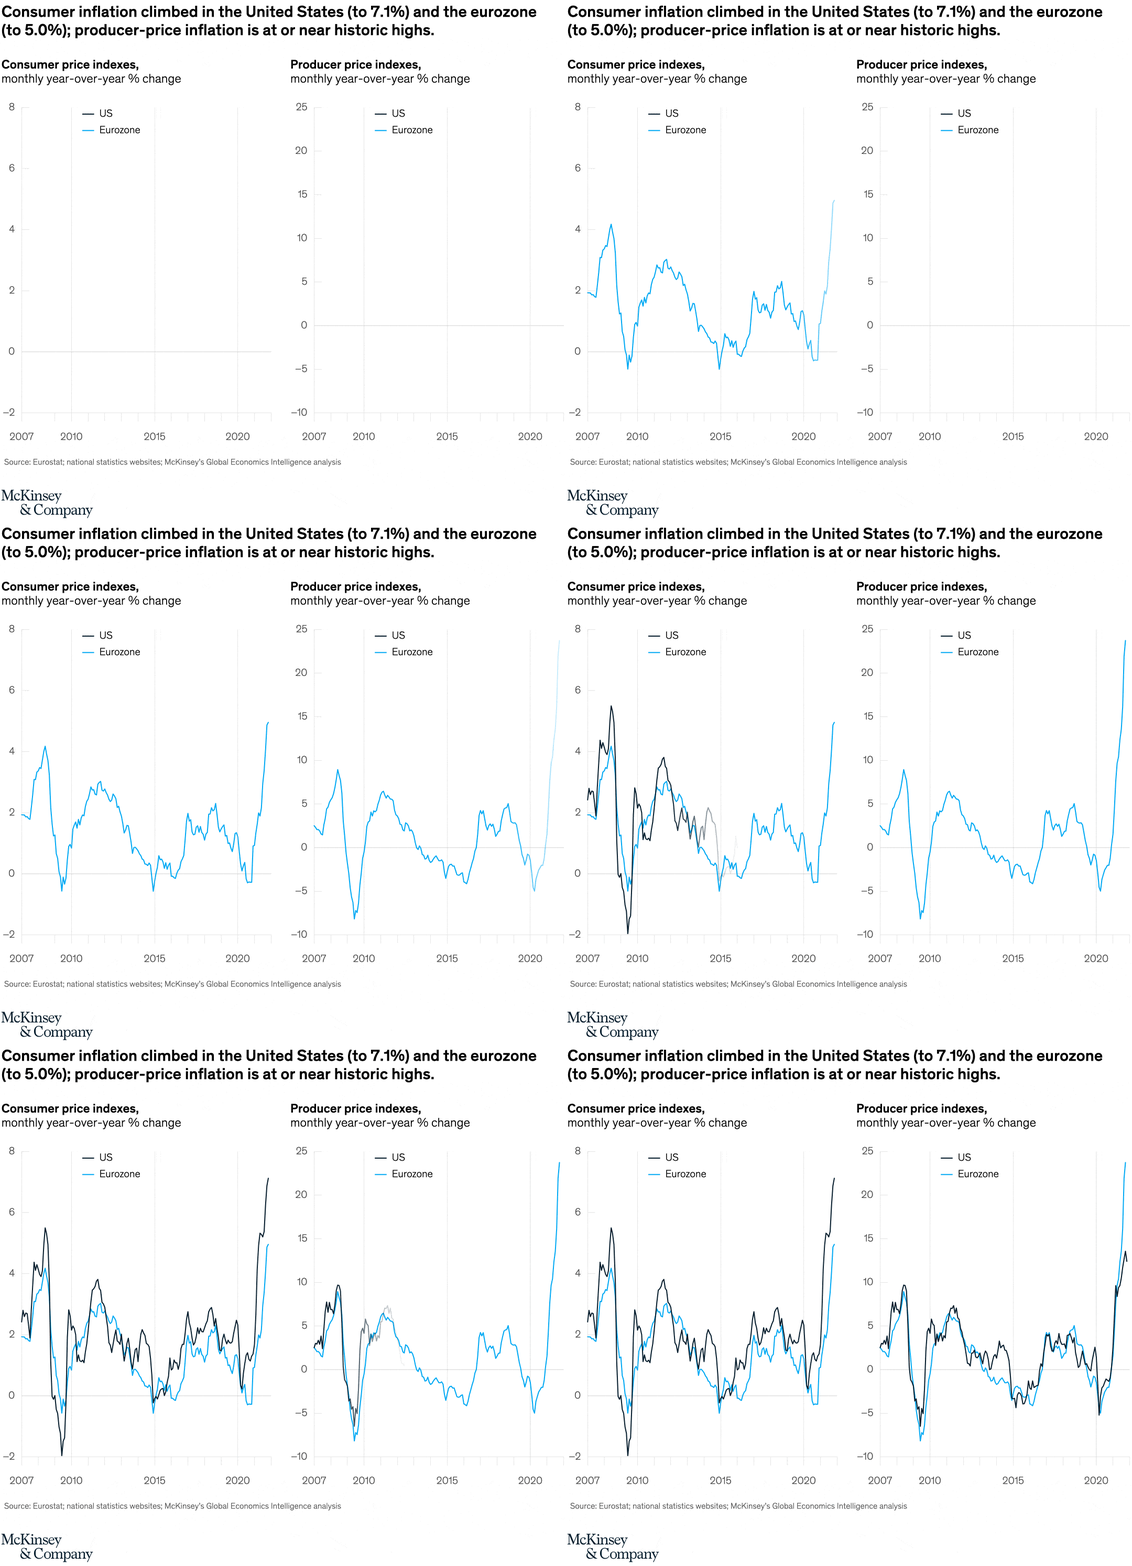
February 10, 2022 – Economies around the world grew quickly in 2021: 5.7 percent in the US, 8.1 percent in China, 5.2 percent in the eurozone, 9 percent in India. As economies have heated up, consumer inflation has soared, reaching 7.1 percent in the US in December. Producer price inflation has also risen sharply, particularly in the eurozone.
To read the article, see “Global Economics Intelligence executive summary,” February 7 2022.
customizer here
Visual form
Two-panel time-series line chart.
Layout / body structure
The chart places two aligned line charts side by side or in parallel columns, one for consumer-price inflation and one for producer-price inflation. Reader tracks the United States and eurozone lines within each panel and then compares the two panels to see how price pressures differ between consumer and producer measures.
What is being compared
The chart compares consumer and producer price inflation in the United States and the eurozone over time. It is therefore a geography comparison and a price-measure comparison at the same time.
Measurement system
Both panels are measured as monthly year-over-year percent change. The consumer-price panel is explicitly framed around inflation climbing to 7.1 percent in the United States and 5.0 percent in the eurozone, while the producer-price panel shows much higher spikes on a scale reaching toward 25 percent.
Visible structure inside the graphic
Each panel uses two lines – one for the United States and one for the eurozone – on the same time axis, with long histories running from the late 2000s through 2020 and beyond. The consumer-price chart shows a lower-range climb, while the producer-price chart rises much more sharply, so the side-by-side structure makes the difference in intensity visible immediately.
Main takeaway from the visual
Inflation pressure is broad in both economies, but producer prices are running hotter than consumer prices. The steep rise in the producer-price panel and the simultaneous climb in the consumer-price panel make the page read like a pipeline-pressure story in which upstream cost stress is more extreme.
Key standout values or extremes
The clearest labeled consumer-price anchors are 7.1 percent for the United States and 5.0 percent for the eurozone. In the producer-price panel, the strongest visible extreme is the surge toward the upper end of the chart, near the 20-to-25 percent range, which is much higher than anything shown on the consumer side.
Controls / sequence, when applicable
This is a static chart image with no in-chart controls to operate.
Companion media, when applicable
There is no separate companion audio or video; the chart image is the full visual on this page.