Source page: McKinsey & Company
Commentary
Rural America’s complex economic portrait
Economic Development | Infrastructure | North America
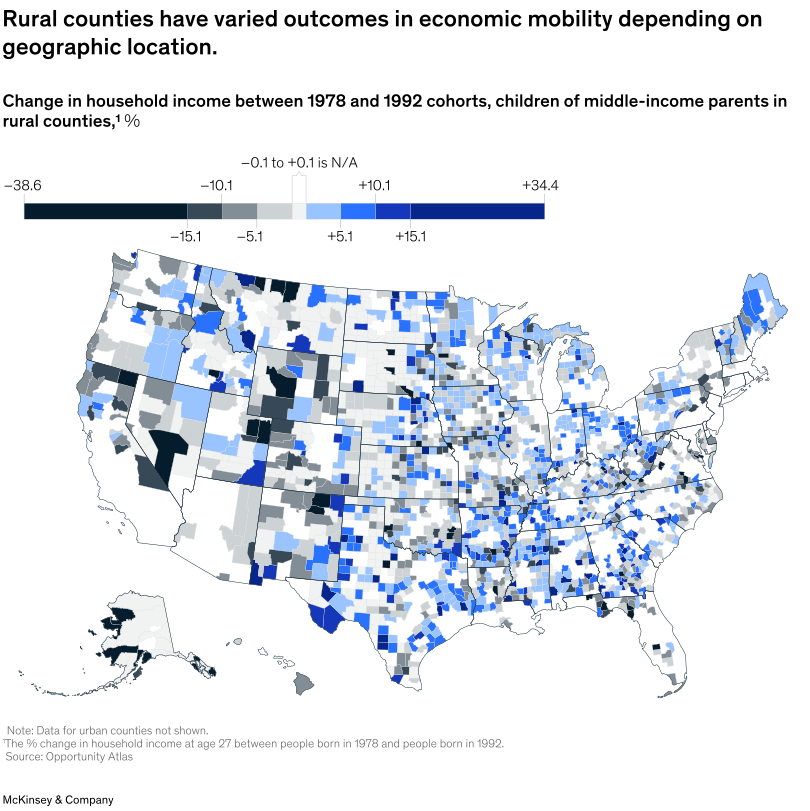
April 22, 2025 – Economic mobility in rural America varies significantly by geographic location. The percentage change in household income for children born to middle income parents in 1978 and 1992 shows substantial variation across North American counties, according to Senior Partner Shelley Stewart III and coauthors. Local economic conditions, labor market dynamics, access to quality education, cost-of-living variations, government programs, demographic shifts, and technological advancements are drivers of these differences.
To read the article, see “Who is Rural America?,” March 20, 2025.
customizer here
Visual form
Clustered choropleth-style county map with an explanatory band below. The visual classifies rural American counties into archetypes rather than showing one continuous quantitative metric.
Layout / body structure
The layout is map-first, with the contiguous United States filling most of the page, Alaska inset at the lower left, and a legend on the right. Beneath the map, a horizontal explanatory strip describes the five rural community archetypes in text blocks that match the colors used on the map.
What is being compared
The chart compares county-level rural archetypes across the United States. It distinguishes resource-rich regions, great escapes, rural service hubs, Americana, distressed Americana, and also shows non-rural classifications such as smaller independent economies, urban periphery, and urban centers and core suburbs.
Measurement system
This visual is categorical rather than numeric. Color is the measurement system: each shade corresponds to a cluster or archetype, and the county mosaic shows where each type is concentrated geographically.
Visible structure inside the graphic
The main map is a county-by-county patchwork with multiple blue shades for the rural archetypes and grays for non-rural categories. A legend at the right decodes those colors, and the bottom explanatory band turns the map into a map-plus-profile layout by summarizing the defining traits of the five rural archetypes.
Main takeaway from the visual
The visible takeaway is that rural America is not one uniform geography but a patchwork of distinct local economies. Large swaths of the South and parts of Appalachia show distressed Americana, western areas include resource-rich and great-escape counties, and the overall pattern varies dramatically by region.
Key standout values or extremes
The explanatory band notes that distressed Americana includes 18 million people across 973 counties, Americana is the largest rural archetype with 879 counties and 40 million Americans, and resource-rich regions include 177 counties with close to one million people. On the map, distressed and Americana counties dominate large contiguous areas, while resource-rich regions and great escapes appear in more concentrated pockets.
Controls / sequence, when applicable
This is a static chart image with no in-chart controls to operate.
Companion media, when applicable
There is no separate companion audio or video; the chart image is the full visual on this page.