Source page: McKinsey & Company
Commentary
Rural America's diverse realities
Economic Development | Manufacturing
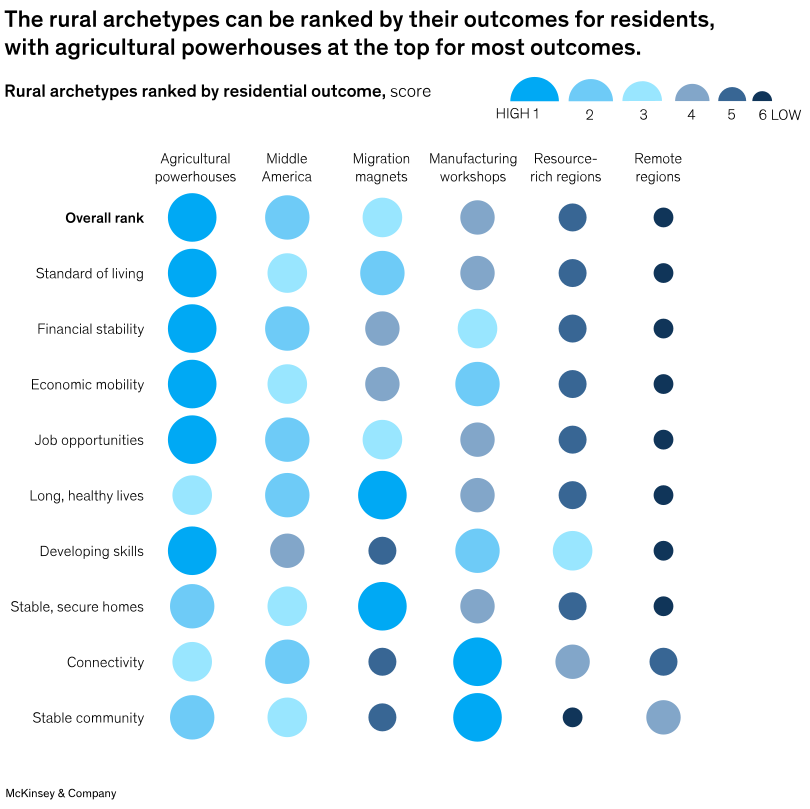
October 8, 2025 – Although rural America is home to 46 million people, these communities are far from the same, with varying degrees of economic mobility and standards of living. In their research exploring US rural areas, Senior Partner Shelley Stewart III and coauthors calculated the outcomes for residents in six rural archetypes. Agricultural powerhouses have the highest standard of living, financial stability, economic mobility, job opportunities, and skill development among rural archetypes. Migration magnets rank highest in long, healthy lives and stable, secure homes, while manufacturing workshops rank highest in connectivity and stable community.
To read the report, see “Small towns, massive opportunity: Unlocking rural America’s potential,” August 4, 2025.
customizer here
Visual form
Table (with Visual Encoding): bubble-matrix outcome ranking for six rural American archetypes.
Layout / body structure
Columns represent rural archetypes, and rows represent resident outcomes. Each cell uses a circle, so the reader scans down a rural-archetype column or across an outcome row.
What is being compared
It compares agricultural powerhouses, Middle America, migration magnets, manufacturing workshops, rural service hubs, and remote regions across outcome categories such as standard of living, financial stability, economic mobility, job opportunities, health, housing, connectivity, and community stability.
Measurement system
The matrix uses relative circle size and color intensity to encode outcome strength. Larger, brighter circles indicate stronger rankings; smaller, darker circles indicate weaker rankings.
Visible structure inside the graphic
Agricultural powerhouses show many large bright circles across the upper outcome rows, while remote regions show mostly small dark circles. Migration magnets and manufacturing workshops stand out in selected rows rather than across the full matrix.
Main takeaway from the visual
The chart shows rural America as a set of distinct outcome profiles, not one uniform category. Agricultural powerhouses lead broadly, while other archetypes have more specific strengths.
Key standout values or extremes
Agricultural powerhouses lead in overall rank, standard of living, financial stability, economic mobility, job opportunities, and developing skills. Migration magnets lead in long, healthy lives and stable, secure homes, while manufacturing workshops lead in connectivity and stable community; remote regions sit lowest across most rows.
Controls / sequence, when applicable
This is a fixed bubble-matrix table; there are no in-chart controls to operate.
Companion media, when applicable
There is no separate companion audio or video; the rural-archetype bubble matrix is the visual on this page.