Source page: McKinsey & Company
Commentary
Savings skyrocketed as Americans locked down
COVID-19 | Economics | North America
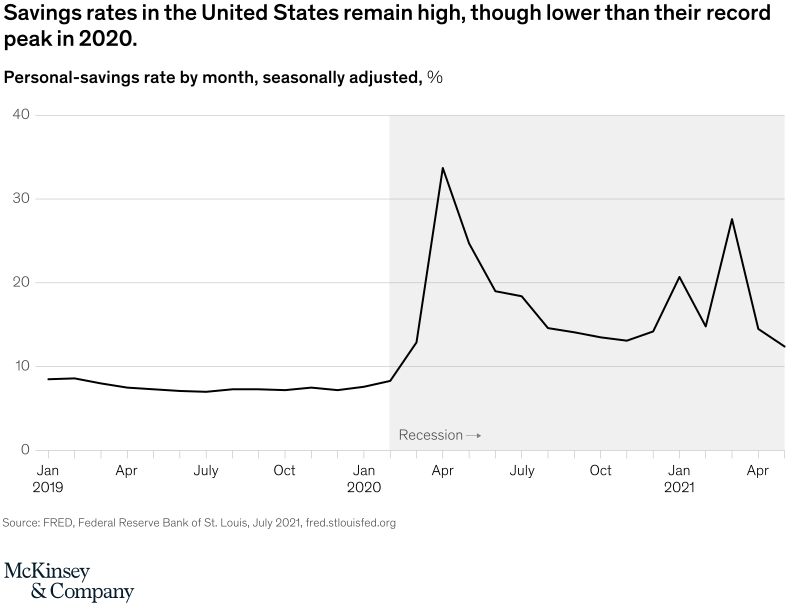
August 9, 2021 – Americans’ personal-savings rate hovered just below 10 percent in the months before the onset of the pandemic. As lockdowns began, savings climbed dramatically, up to nearly 35 percent in spring 2020. The rate has fallen but remains above historical norms, at over 12 percent, as the pandemic lingers.
To read the article, see “Trends that will define 2021 and beyond: Six months on,” July 21, 2021.
customizer here
Visual form
Single-line time-series chart.
Layout / body structure
The chart is one continuous line chart running from 2019 through early 2021, with a shaded recession band covering the pandemic period. Read left to right through the flat pre-pandemic baseline, the sharp spike in 2020, and the elevated but uneven path afterward.
What is being compared
The chart compares the U.S. personal savings rate across months over time. It is fundamentally a before-versus-during-pandemic comparison, with the recession shading highlighting the period where household saving behavior changed abruptly.
Measurement system
The vertical axis measures the personal savings rate in percent, seasonally adjusted, while the horizontal axis marks months across 2019, 2020, and 2021. The gray background shading identifies the recession period.
Visible structure inside the graphic
A single black line runs across the page on a shared percent axis, with date ticks along the bottom and the recession band beginning in early 2020. There are no multiple series or legend keys, so all the emphasis sits on the shape of the line and the sudden break in trend.
Main takeaway from the visual
Savings rates stayed low and stable before the pandemic, then jumped dramatically during the 2020 shutdown period and remained well above their pre-pandemic baseline even after the initial spike faded. The chart makes the surge look like a step change rather than a small cyclical move.
Key standout values or extremes
The line sits around 7 to 8 percent through most of 2019, then spikes above 30 percent in spring 2020 at the peak. It later settles into the teens, briefly climbs back above 25 percent in early 2021, and ends still clearly higher than the pre-2020 level.
Controls / sequence, when applicable
This is a static chart image with no in-chart controls to operate.
Companion media, when applicable
There is no separate companion audio or video; the chart image is the full visual on this page.