Source page: McKinsey & Company
Commentary
Seafood, without the sea
Food | Sustainability
November 10, 2023 – Global demand for fish protein is expected to continue to grow. Yet the amount of wild-caught seafood remains flat, with more of the world’s fisheries being pushed to or beyond their limits. Partner Tom Brennan and colleagues say alternative seafood—plant-based, fermentation-enabled, and cultivated substitutes for fish—could fill some of the gap and provide high-end protein. Several of the most popular seafood varieties, including shrimp, tuna, and salmonids, are among attractive targets for alternatives.
To read the article, see “The next wave: Alternative-seafood solutions,” September 18, 2023.
customizer here
Visual form
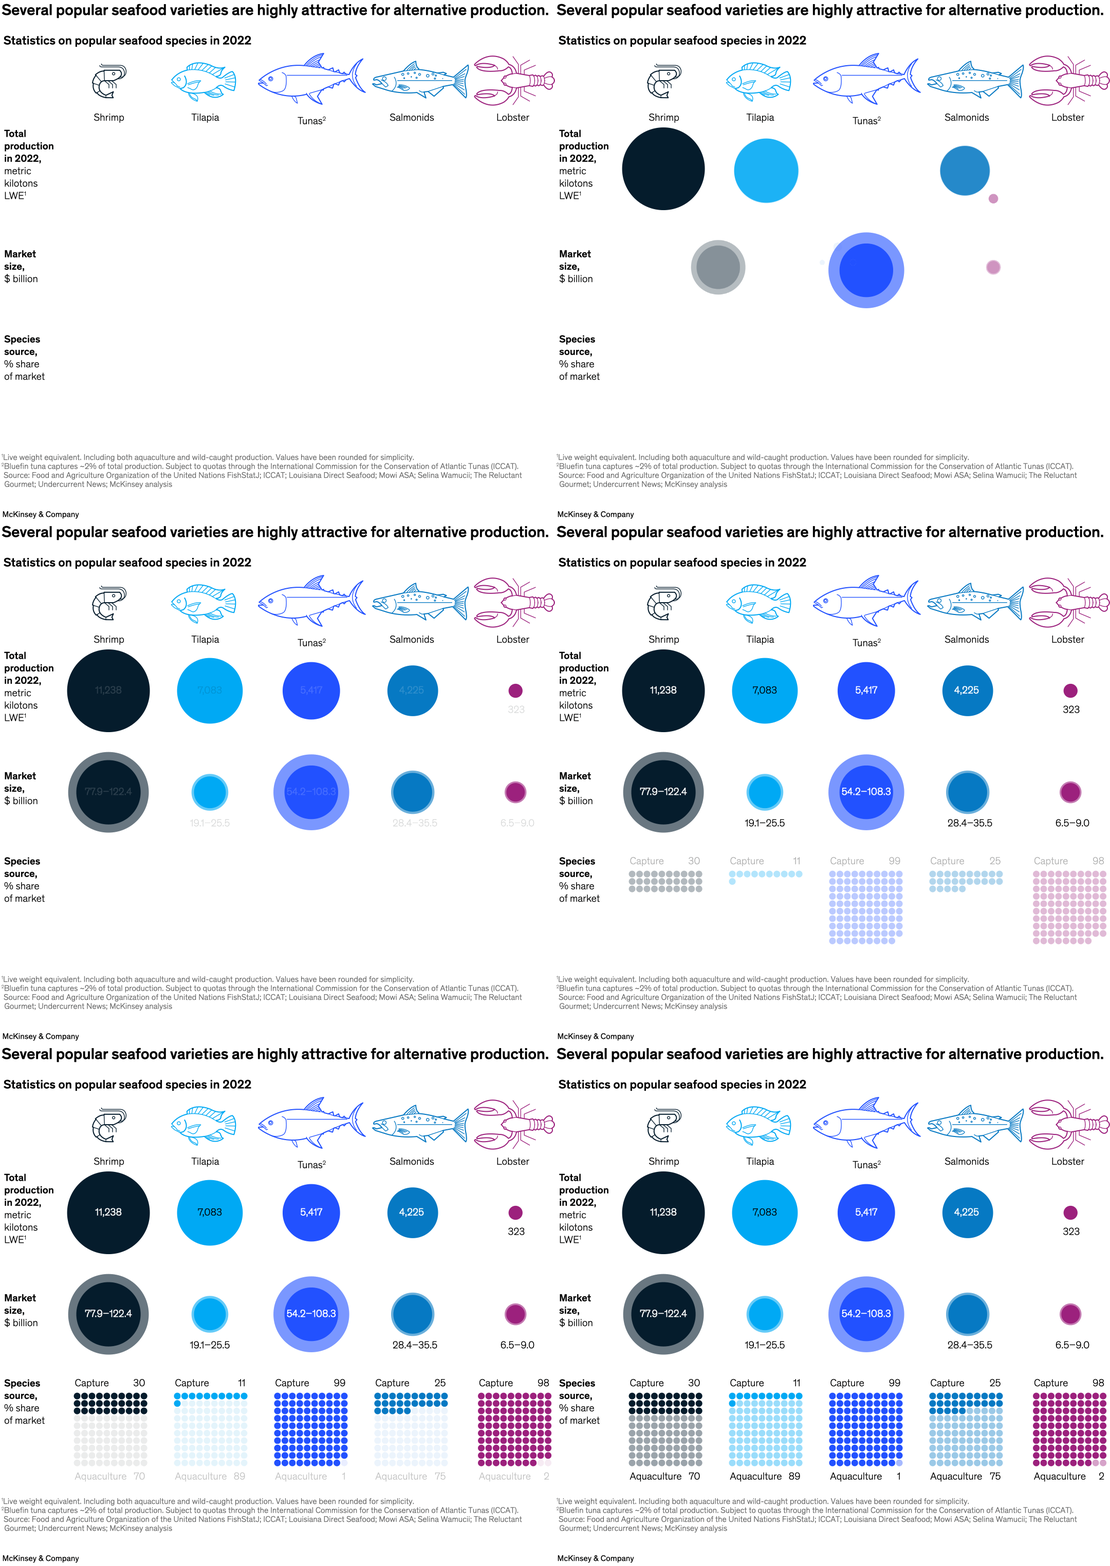
Three-row comparative infographic built from circles and dot matrices. It compares seafood species on production volume, market size, and source mix within one vertically stacked layout.
Layout / body structure
The chart is read top to bottom across three measurement rows. Across each row the same five species appear left to right: shrimp, tilapia, tunas, salmonids, and lobster, so the reader can compare the species consistently across output, market value, and source composition.
What is being compared
The visual compares several seafood categories on 2022 production volume, market size, and the split between capture and aquaculture. It is designed to show which species offer the largest economic opportunity for alternative production and how dependent each category is on farmed versus wild-caught supply.
Measurement system
The first row is measured in metric kilotons live weight equivalent, the second row in billions of dollars of market size, and the third row as percentage source share. Circle size and labels carry the first two rows, while the bottom dot grids show the capture-versus-aquaculture split as percentages.
Visible structure inside the graphic
The top row uses species illustrations and large labeled circles for production volume, the middle row repeats the circle comparison for market value, and the bottom row uses 100-dot matrices split between capture and aquaculture. The repeated left-to-right species order is what ties the three measurement rows together.
Main takeaway from the visual
Several major seafood categories look attractive for alternatives, but they differ sharply in scale and in how dependent they already are on aquaculture. The infographic makes that visible by pairing very large production and market circles for shrimp and tunas with very different source splits at the bottom: shrimp is mostly aquaculture while tunas are overwhelmingly capture-based.
Key standout values or extremes
Shrimp has the largest production volume at 11,238 kilotons and the biggest market range at 77.9 to 122.4 billion dollars. Tunas carry a very large market range at 54.2 to 108.3 billion dollars but are almost entirely capture-sourced at 99 percent, while tilapia is 89 percent aquaculture and salmonids are 75 percent aquaculture.
Controls / sequence, when applicable
This is a static chart image with no in-chart controls to operate.
Companion media, when applicable
There is no separate companion audio or video; the chart image is the full visual on this page.