Source page: McKinsey & Company
Commentary
Second time right
COVID-19 | Public Health
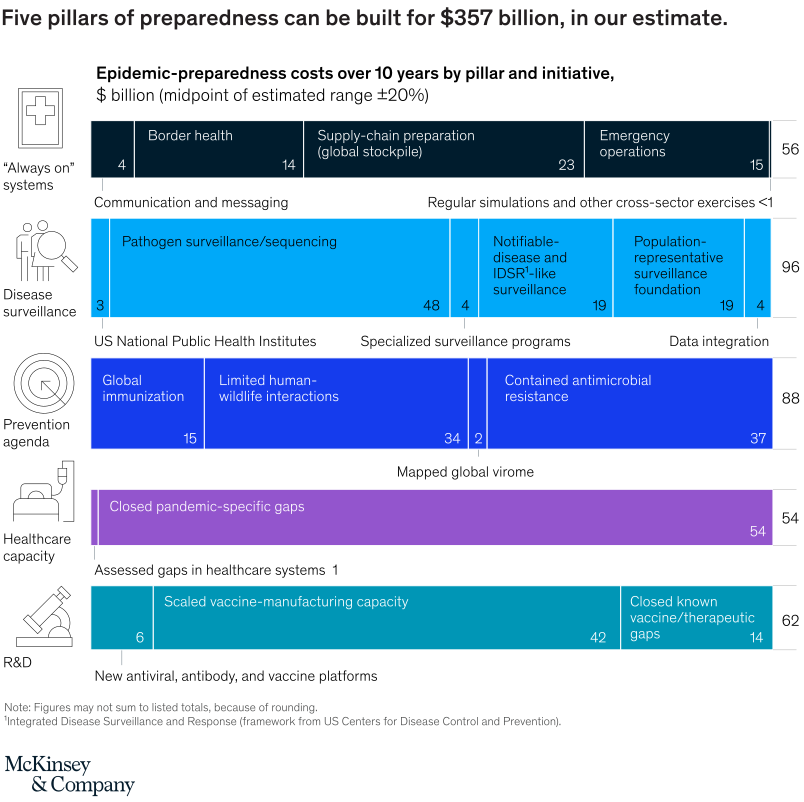
June 10, 2021 – COVID-19 tested the world’s ability to monitor and respond to an outbreak of a deadly infectious disease. The results were mixed at best. To avoid a repeat, we estimate that the world’s public-health agencies could invest $357 billion over the next decade. That’s about $5 per person, per year.
To read the article, see “Not the last pandemic: Investing now to reimagine public-health systems,” May 21, 2021.
customizer here
Visual form
Five-row stacked initiative-cost chart.
Layout / body structure
The chart is built as five horizontal rows, one for each preparedness pillar, with initiative blocks stacked left to right inside each row. Read from the top pillar to the bottom pillar, and within each row read the labeled segments from left to right before checking the total shown at the far right.
What is being compared
The chart compares estimated ten-year epidemic-preparedness costs across five pillars: always on systems, disease surveillance, prevention agenda, healthcare capacity, and research and development. Within each pillar it also compares the underlying initiatives that add up to the total, such as border health, stockpiles, pathogen surveillance, immunization, pandemic-specific gaps, and vaccine-manufacturing capacity.
Measurement system
The amounts are measured in billions of dollars and represent the midpoint of an estimated range plus or minus 20 percent. Each row is a stacked bar made of labeled initiative blocks with their own values, and the pillar total is printed at the right edge of the row.
Visible structure inside the graphic
Each pillar has a distinct color and icon on the left, followed by one long segmented bar with initiative names printed inside the blocks. Disease surveillance, prevention agenda, and research and development each contain multiple segments, while healthcare capacity is dominated by one long purple block, so the graphic doubles as both a pillar comparison and an initiative breakdown.
Main takeaway from the visual
Disease surveillance is the costliest pillar on the page, and prevention agenda and research and development are also major spending blocks, while always on systems and healthcare capacity come in lower. The visual makes the distribution clear because the disease-surveillance row is the longest and its total at the right, 96, exceeds every other pillar total.
Key standout values or extremes
The pillar totals are 56 billion dollars for always on systems, 96 for disease surveillance, 88 for prevention agenda, 54 for healthcare capacity, and 62 for research and development, for a headline total of 357 billion dollars. Within the rows, pathogen surveillance and sequencing is the single largest named initiative at 48, closed pandemic-specific gaps is 54 inside healthcare capacity, scaled vaccine-manufacturing capacity is 42 in research and development, and contained antimicrobial resistance is 37 in the prevention agenda row.
Controls / sequence, when applicable
This is a static chart image with no in-chart controls to operate.
Companion media, when applicable
There is no separate companion audio or video; the chart image is the full visual on this page.