Source page: McKinsey & Company
Commentary
Seeds of sustainability
Agriculture | Sustainability
May 6, 2024 – Agriculture accounts for nearly a quarter of global emissions, making sustainable farming practices necessary to meet decarbonization goals and broader environmental targets. Partner David Fiocco and coauthors find that adoption of those practices by farmers is highly correlated with the perceived return on investment. In a survey, farmers said that although they generally expect the use of sustainable-farming practices to raise their costs, they also expect this increase to pay dividends in higher crop yield, land value appreciation, and better crop pricing.
To read the survey, see “Voice of the US farmer 2023–24: Farmers seek path to scale sustainability,” April 9, 2024.
customizer here
Visual form
Scatter plot.
Layout / body structure
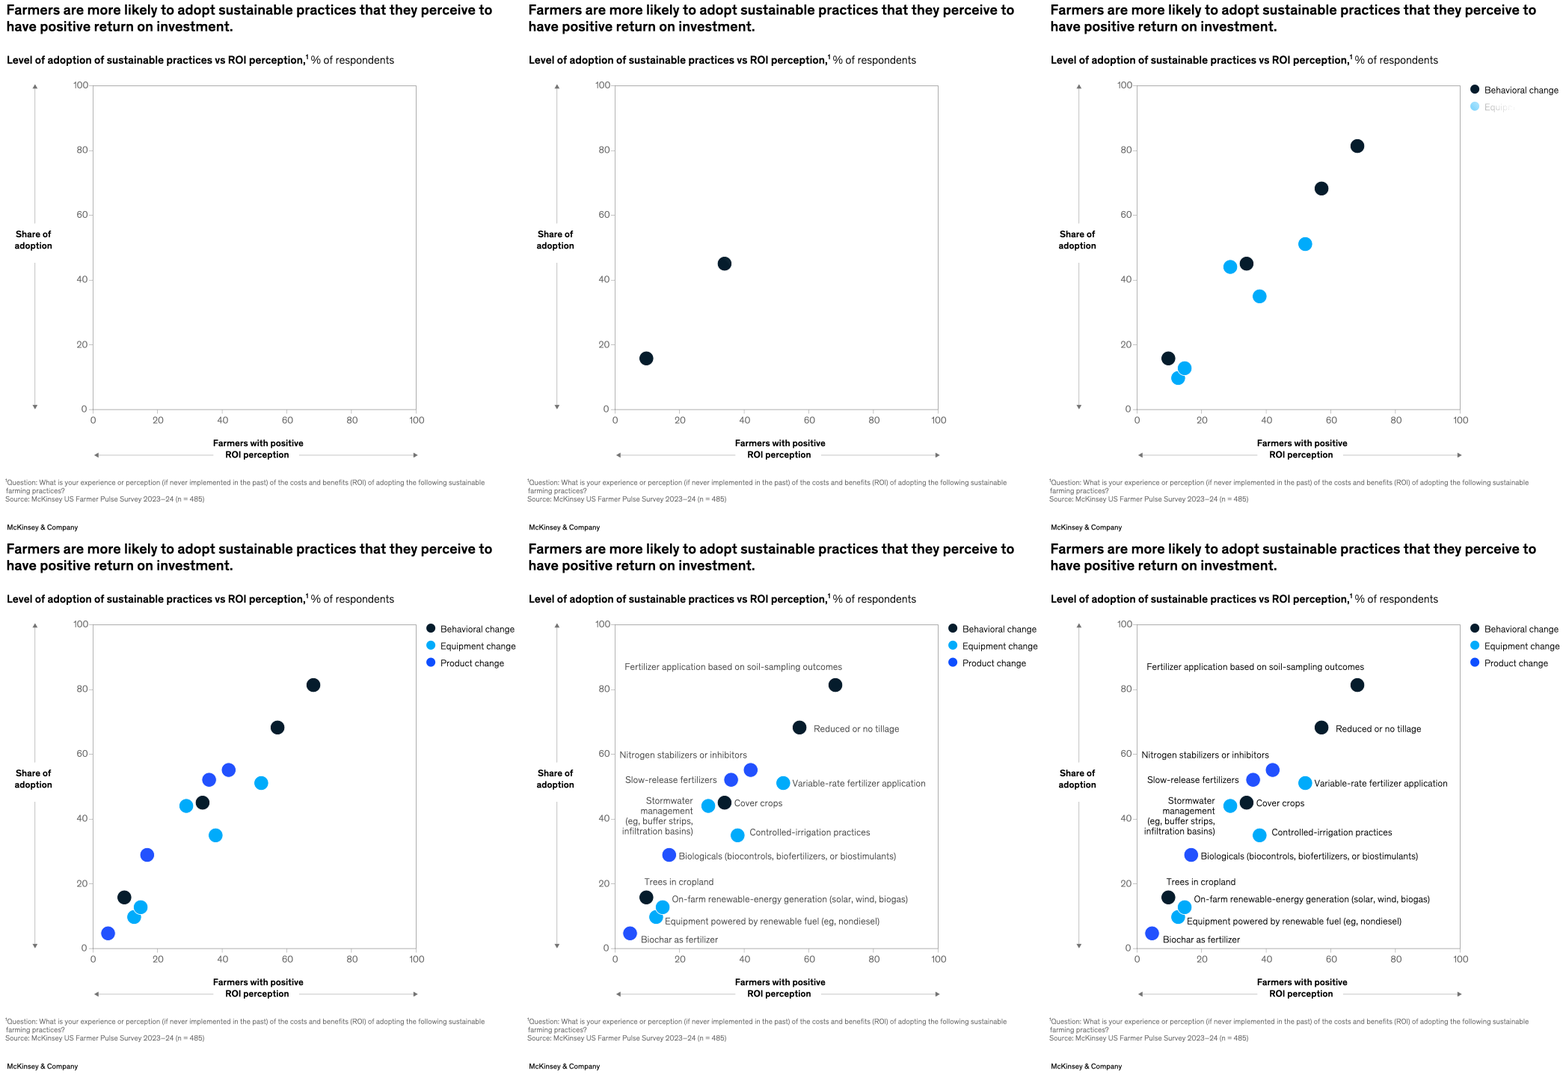
This is a single two-axis scatter plot with labeled practice dots spread across the field. The reading order is across the positive-ROI axis first and then up the adoption axis, while color separates behavioral, equipment, and product changes.
What is being compared
It compares farmers’ perception that a sustainable practice has positive return on investment against the current share of adoption for that practice.
Measurement system
Both axes are percentages of respondents. The horizontal axis tracks positive ROI perception and the vertical axis tracks adoption share, while color groups the practices by change type.
Visible structure inside the graphic
Each sustainable practice is plotted as a labeled dot. The higher-right part of the chart contains practices that farmers both value and adopt more often, while the lower-left side contains practices with weaker adoption and weaker ROI perception.
Main takeaway from the visual
The plot shows that adoption tends to rise where farmers believe the payoff is stronger, which is why practices perceived as economically attractive sit higher and farther right than lower-confidence practices.
Key standout values or extremes
Practices such as fertilizer application based on soil-sampling outcomes and reduced or no tillage sit in the upper-right portion of the chart, while options such as biochar and equipment powered by renewables remain closer to the lower-left with low adoption and lower perceived ROI.
Controls / sequence, when applicable
This is a static chart image with no in-chart controls to operate.
Companion media, when applicable
There is no separate companion audio or video; the chart image is the full visual on this page.