Source page: McKinsey & Company
Commentary
Seeking e-commerce superstars
Retail | E-commerce
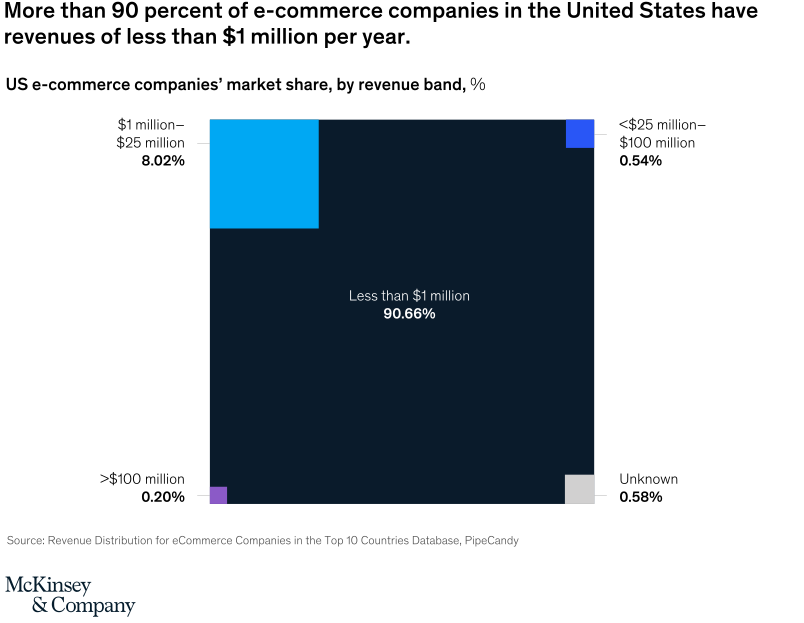
November 29, 2021 – The bar for entry in the world of e-commerce is low, but outsize ROIs are rare. Potential investors have plenty of options but they may want to consider that only 0.20 percent of digitally native brands earn more than $100 million annually.
To read the article, see “Digitally native brands: Born digital, but ready to take on the world,” October 27, 2021.
customizer here
Visual form
Treemap market-share chart.
Layout / body structure
The chart is a single treemap with one dominant central block and four much smaller surrounding blocks annotated outside the rectangle. Reader starts with the oversized center block and then scans the labeled edge slices to see how the remaining revenue bands divide up the rest of the market.
What is being compared
The chart compares US e-commerce companies by revenue band. It shows how market share is distributed across companies with less than 1 million dollars in annual revenue, 1 to 25 million dollars, 25 to 100 million dollars, more than 100 million dollars, and an unknown category.
Measurement system
Each block is measured as percent market share. The biggest rectangle has its percentage printed inside it, and the smaller bands are labeled outside the chart with their shares, so area and text work together to show how concentrated the distribution is.
Visible structure inside the graphic
The central dark block fills almost the entire treemap and is labeled Less than 1 million at 90.66 percent. Around it sit a light-blue 1 to 25 million block at 8.02 percent, a tiny blue 25 to 100 million block at 0.54 percent, a small gray unknown block at 0.58 percent, and a very thin purple more than 100 million block at 0.20 percent.
Main takeaway from the visual
The e-commerce company base is overwhelmingly made up of very small-revenue businesses. The treemap makes that clear immediately because the less-than-1-million block dominates almost the full chart area while every other revenue band appears as a thin remainder around the edges.
Key standout values or extremes
The strongest number on the page is the 90.66 percent share for companies with less than 1 million dollars in annual revenue. The next-largest band is only 8.02 percent for the 1 to 25 million dollar group, while every remaining category is under 1 percent, including 0.54 percent for 25 to 100 million, 0.58 percent unknown, and 0.20 percent for more than 100 million.
Controls / sequence, when applicable
This is a static chart image with no in-chart controls to operate.
Companion media, when applicable
There is no separate companion audio or video; the chart image is the full visual on this page.