Source page: McKinsey & Company
Commentary
Shareholder activism aftermath
Corporate finance | Investing
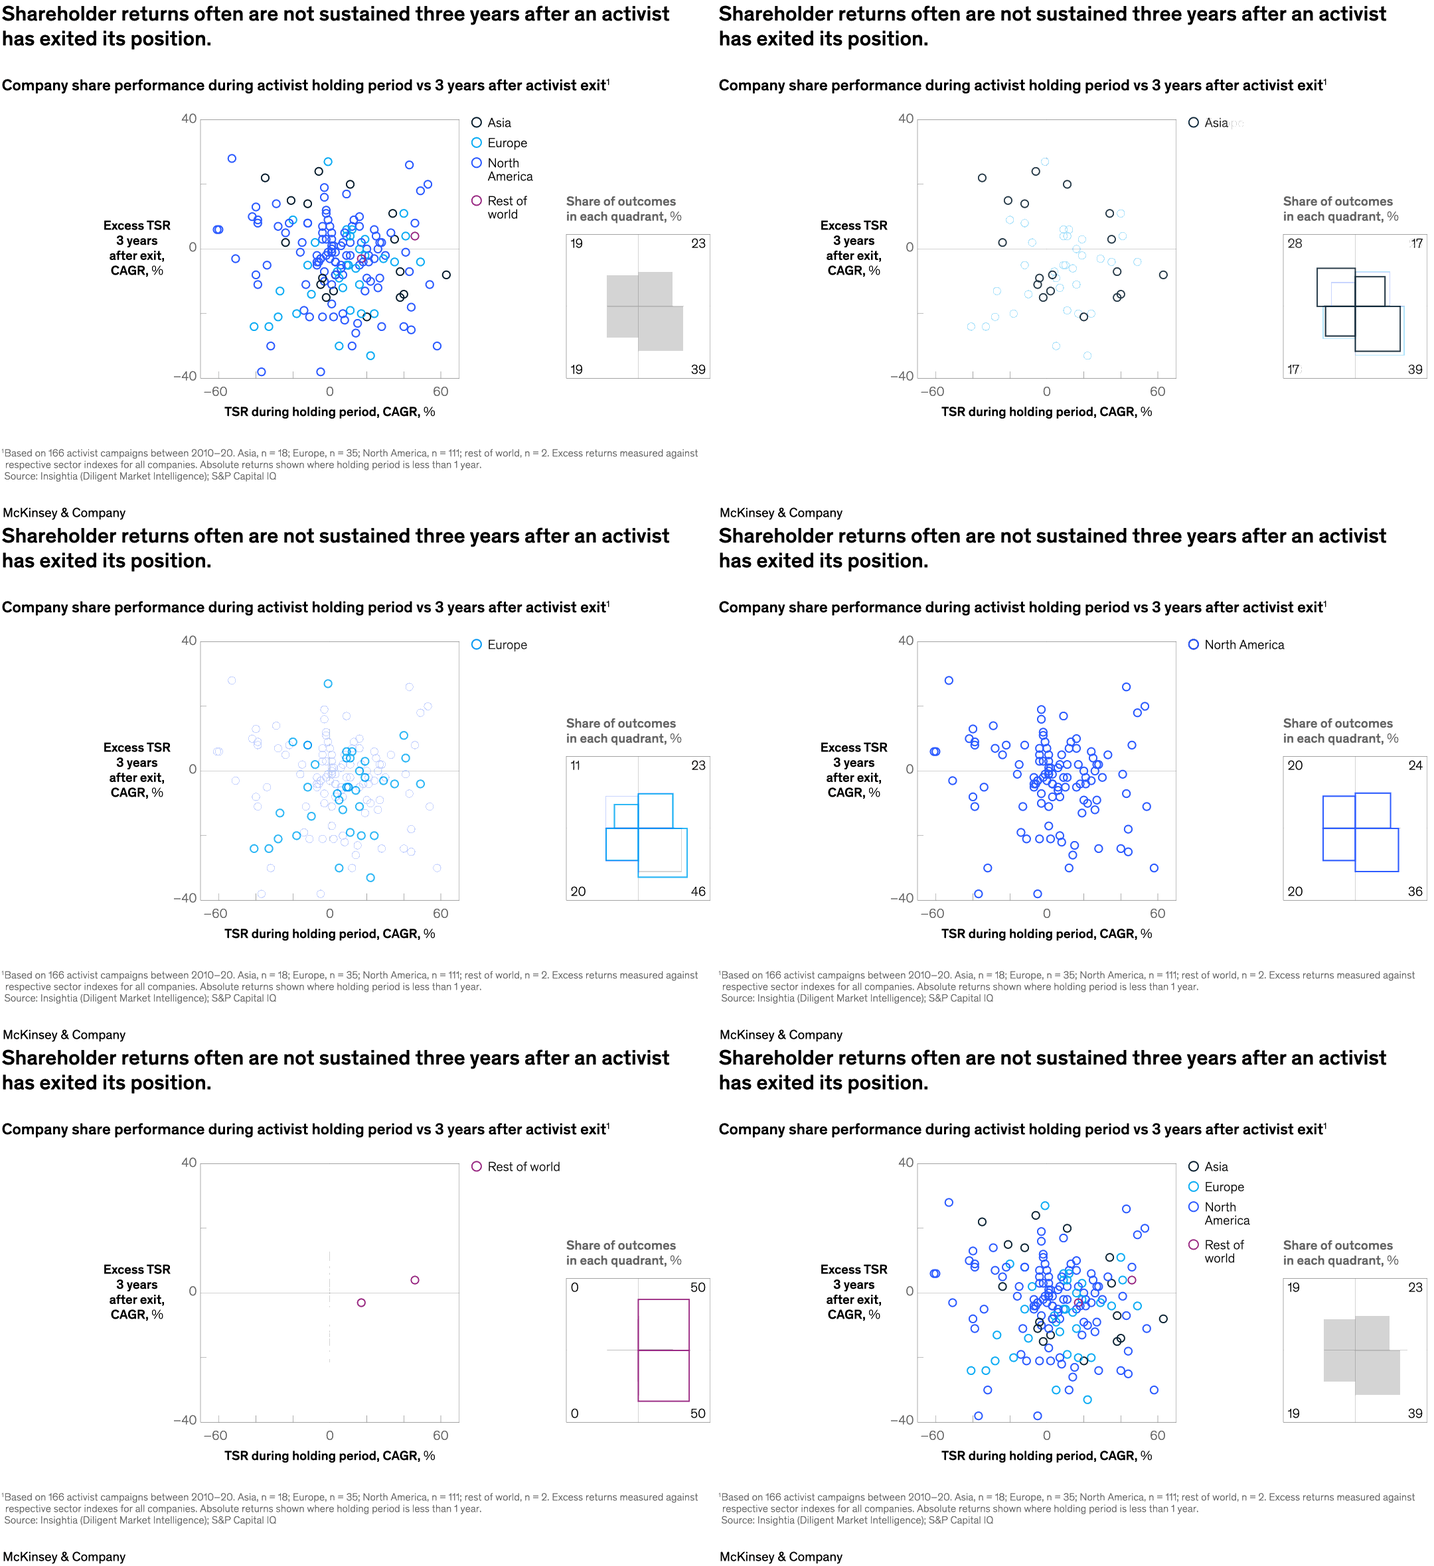
July 26, 2024 – Shareholder activists often boost a company’s valuation during their campaigns, and the gains last for the first three years. However, the situation is less clear after the activist exits, note partner Joseph Cyriac and colleagues. About 40 percent of companies that benefited while under activist influence saw negative three-year excess total shareholder returns after the activist departed, based on an analysis of nearly 170 global shareholder activist campaigns over the past decade. That’s nearly double the number of companies that experienced positive returns during the same postexit period.
To read the article, see “Do shareholder activists create lasting value?,” July 5, 2024.
customizer here
Visual form
Scatter plot with a quadrant summary inset.
Layout / body structure
The main plot sits in the center with one point per campaign, the horizontal axis tracking returns during the activist holding period and the vertical axis tracking excess returns three years after exit, while a smaller inset on the right summarizes the share of outcomes in each quadrant.
What is being compared
It compares short-term activist-period share performance against longer-run performance after the activist has exited, across campaigns from multiple regions.
Measurement system
Both axes are CAGR percentages, the point colors indicate region, and the inset converts the quadrant distribution into percentage shares of all observations.
Visible structure inside the graphic
Open colored circles are spread across four quadrants around the zero-zero crosshair, with most points clustering close to the center but still spilling into all four outcome zones; the inset mirrors that quadrant logic with labeled percentages in each corner.
Main takeaway from the visual
The chart shows that strong returns during the activist holding window do not reliably persist after exit, because many outcomes shift into flat or negative excess-return territory once the post-exit period is measured.
Key standout values or extremes
The quadrant inset shows 39 percent of observations in the lower-right quadrant, versus 23 percent in the upper-right, 19 percent in the upper-left, and 19 percent in the lower-left, which means the most common outcome combines positive holding-period returns with weaker or negative excess returns afterward.
Controls / sequence, when applicable
This is a static chart image with no in-chart controls to operate.
Companion media, when applicable
There is no separate companion audio or video; the chart image is the full visual on this page.