Source page: McKinsey & Company
Commentary
Shrinking profit pools
Financial services | Banking
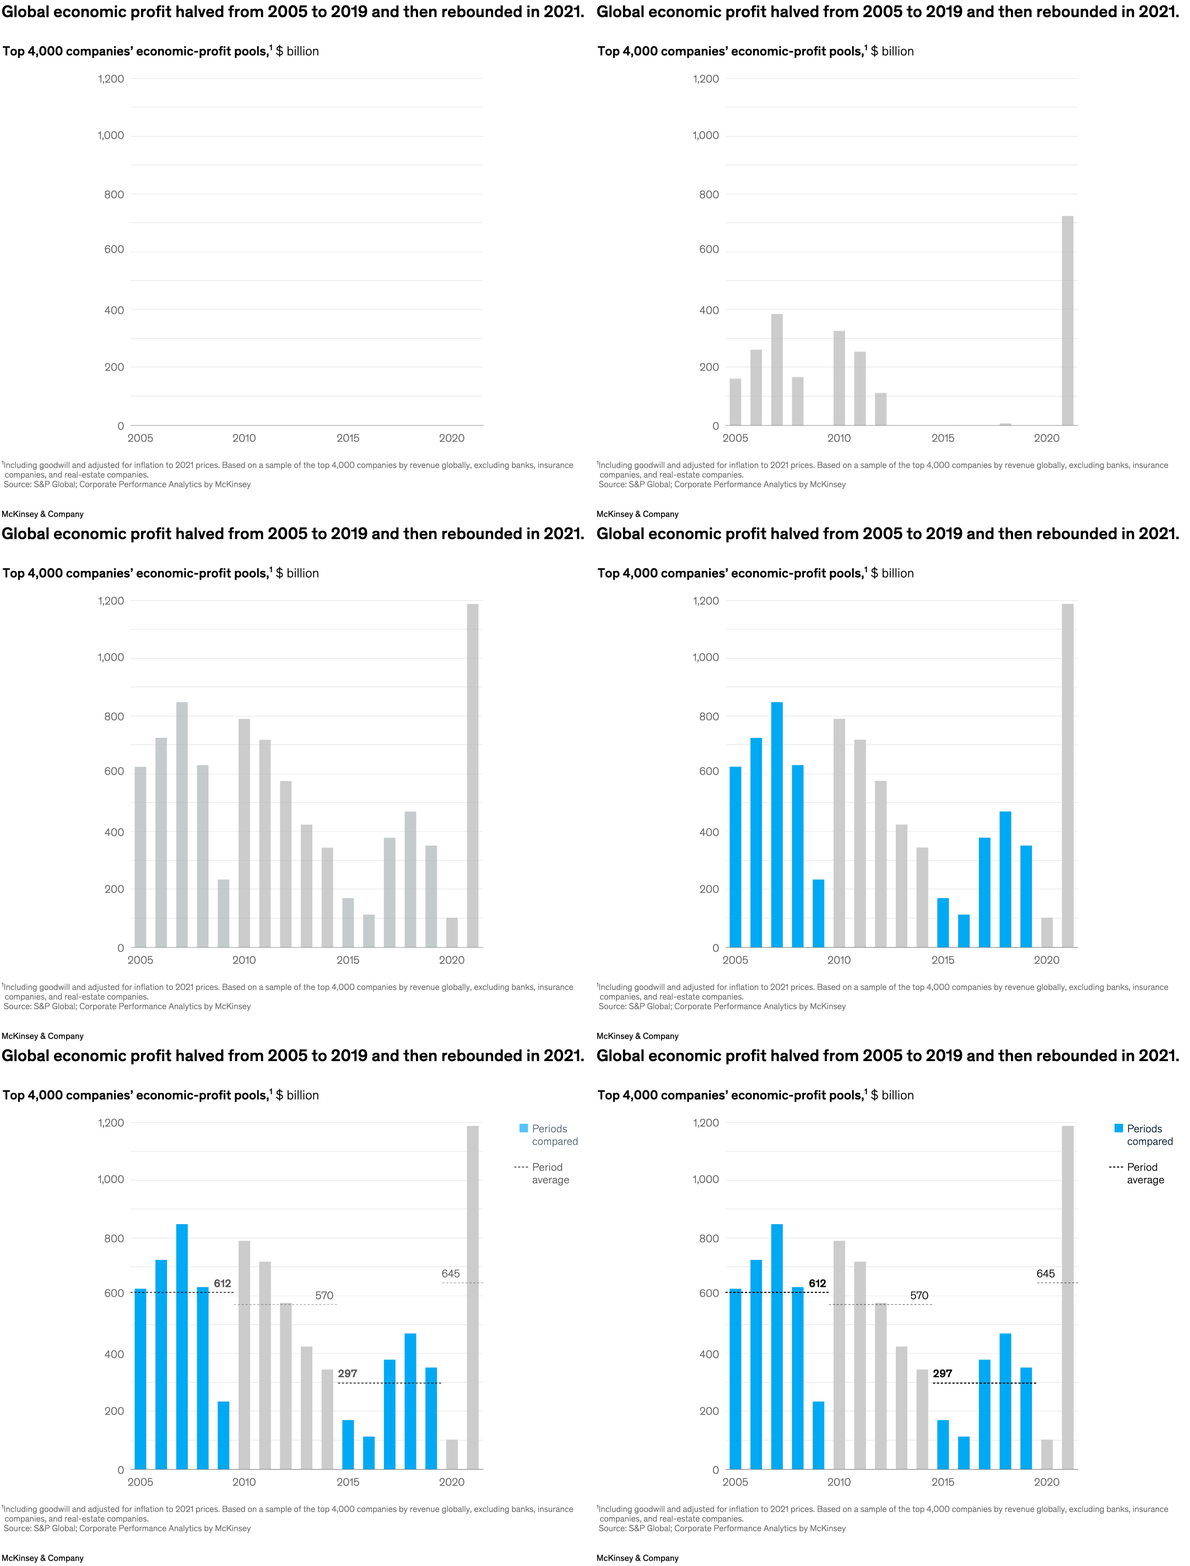
May 15, 2023 – Despite impressive global GDP growth in the past two decades, companies’ aggregate economic profits have been contracting. Analyzing the economic-profit pools of the world’s top 4,000 companies, senior partner Marc de Jong and colleagues find that global economic profit halved from 2005 to 2019 before rebounding in 2021. Profit pools aren’t keeping up with companies’ revenues, however, leading to a long-term crunch in global net economic profit.
To read the article, see “Working hard for the money: The crunch on global economic profit,” April 21, 2023.
customizer here
Visual form
Vertical bar time-series chart.
Layout / body structure
A single chart places one blue bar per selected year across the page, with the title and unit line above and the notes and source beneath the plot.
What is being compared
It compares the economic-profit pools of the top 4,000 companies across selected years from 2005 through 2021.
Measurement system
The vertical measure is economic profit in billions of dollars, and the horizontal measure is year, so the reader follows the changing height of one series across the full business-cycle span.
Visible structure inside the graphic
The chart uses a simple run of vertical columns with no secondary series, which makes the story depend entirely on the changing height of the bars from the high mid-2000s levels through the later trough and the 2021 rebound.
Main takeaway from the visual
The chart shows profit pools shrinking sharply over the long run before snapping back in 2021, so the rebound reads as a break from a much weaker pre-2021 stretch rather than as steady growth.
Key standout values or extremes
The early bars sit much higher than the late-2010s trough, and the 2021 column climbs back to just under 800 billion dollars after the visible compression in the years before it.
Controls / sequence, when applicable
This is a static chart image with no in-chart controls to operate.
Companion media, when applicable
There is no separate companion audio or video; the chart image is the full visual on this page.