Source page: McKinsey & Company
Commentary
Silent but deadly
COP-26 | Agriculture | Oil & Gas | Sustainability
November 2, 2021 – Methane gets second billing in climate-change discussions, but it’s a huge problem, accounting for 30 percent of the planet’s rise in temperature. CO2 stays in the atmosphere for centuries; CH4 hangs around for just a decade, but traps many times more heat. Oil wells, cattle, landfills, cattle, coal mines—and did we mention cattle?—account for much of the problem.
To read the report, see “Curbing methane emissions: How five industries can counter a major climate threat,” September 23, 2021.
customizer here
Visual form
Treemap share chart.
Layout / body structure
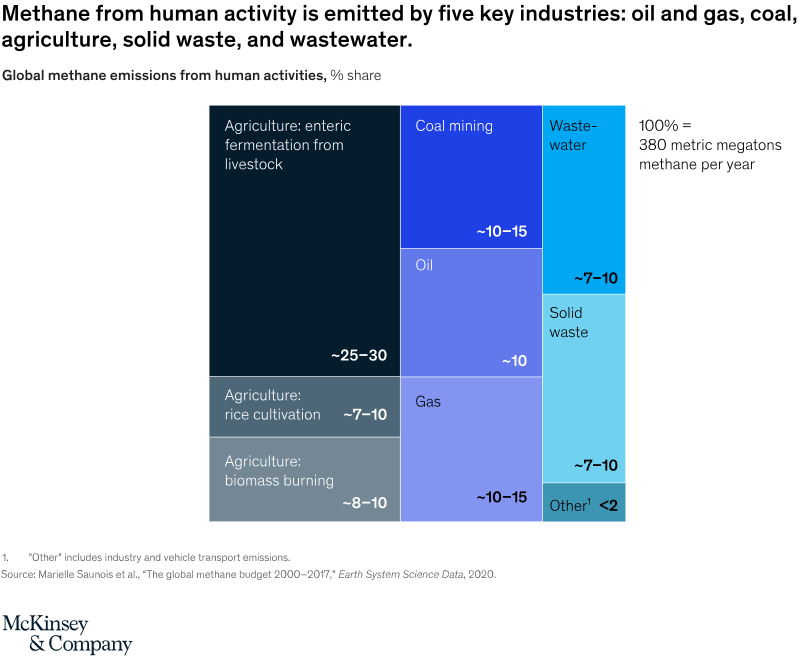
The chart is a single treemap rectangle subdivided into labeled industry blocks, with a short legend-like note to the right showing that the full square represents 100 percent of 380 metric megatons of methane per year. Reader compares block size and printed value ranges across the major methane-emitting sources.
What is being compared
The chart compares global methane emissions from human activities across five key industries and their subcomponents. It contrasts agriculture, coal mining, oil, gas, wastewater, solid waste, and a small residual other category.
Measurement system
Each block is measured as a percentage share of total human-caused methane emissions, with approximate ranges printed inside the rectangles. The full chart corresponds to 100 percent, or 380 metric megatons of methane per year.
Visible structure inside the graphic
The largest section is the agriculture-enteric-fermentation block on the left at about 25 to 30 percent, with smaller agricultural blocks below it for rice cultivation and biomass burning. The middle column divides coal mining, oil, and gas, while the right column stacks wastewater, solid waste, and a tiny other category, making the treemap read as one dominant agricultural source plus several medium-sized fossil-fuel and waste sources.
Main takeaway from the visual
Methane emissions are concentrated in a handful of large sources, with agriculture – especially enteric fermentation – occupying the single biggest share. The treemap makes that concentration obvious because one agricultural block dominates the left side while the rest of the emissions are spread across several smaller but still meaningful sectors.
Key standout values or extremes
The biggest printed range is agriculture enteric fermentation at about 25 to 30 percent. Coal mining and gas are each around 10 to 15 percent, oil is about 10 percent, wastewater and solid waste are each around 7 to 10 percent, agriculture biomass burning is about 8 to 10 percent, rice cultivation is about 7 to 10 percent, and the other category is under 2 percent.
Controls / sequence, when applicable
This is a static chart image with no in-chart controls to operate.
Companion media, when applicable
There is no separate companion audio or video; the chart image is the full visual on this page.