Source page: McKinsey & Company
Commentary
Sluggish spending
Retail | Consumer
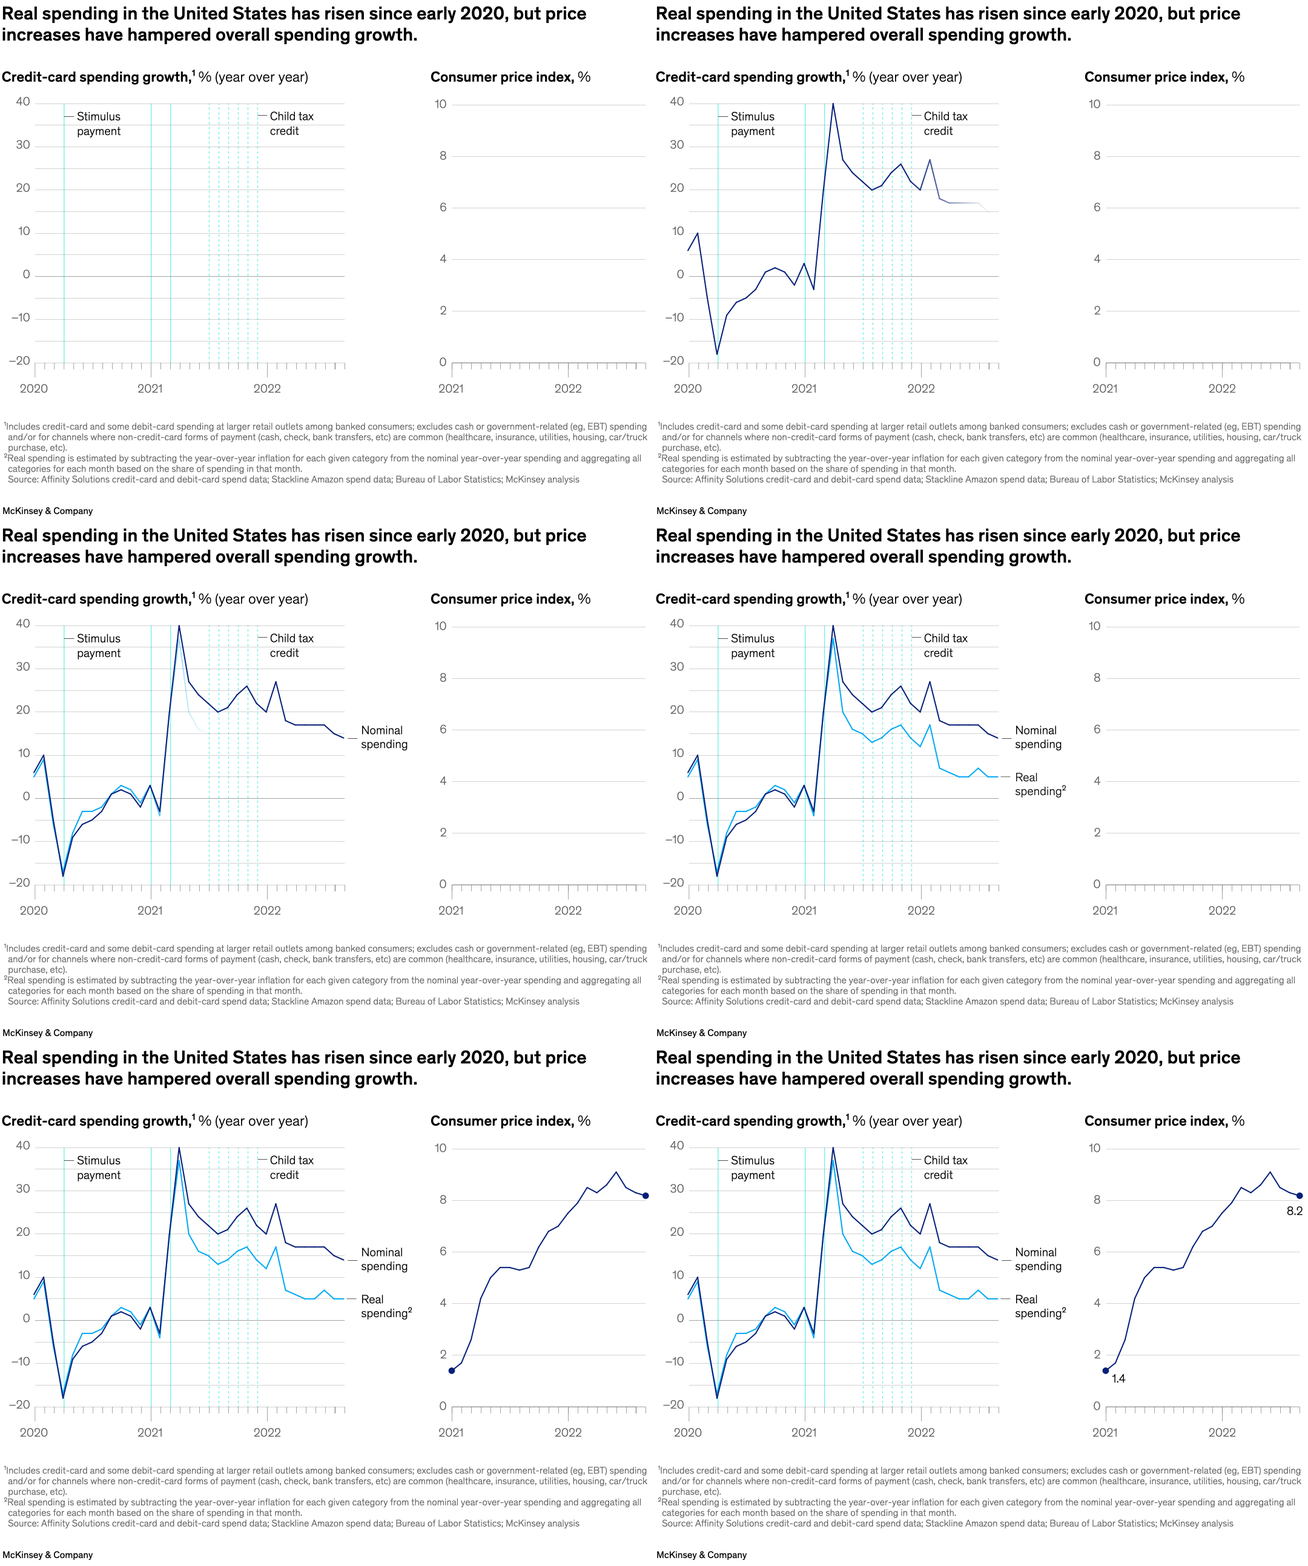
December 21, 2022 – Real spending in the United States had been climbing since the early days of the COVID-19 pandemic. But then inflation rose, too, causing consumers to think twice before pulling out their credit cards this holiday season. Now, say senior partner Becca Coggins and coauthors, pessimistic consumer sentiment is among the factors leading to overall growth that is lower than during the prepandemic period.
To read the article, see “Hitting the mark: Why markdowns matter more than ever,” December 2, 2022.
customizer here
Visual form
Line chart.
Layout / body structure
The visual is a single time-series chart that runs across the page, with the spending trend and the inflation-adjusted slowdown read from left to right over the pandemic and post-pandemic period.
What is being compared
It compares real consumer spending in the United States over time, especially the difference between headline spending growth and the slower underlying growth once price increases are taken into account.
Measurement system
The chart tracks real spending through time, so the reader follows indexed or inflation-adjusted consumer expenditure levels along the horizontal date axis.
Visible structure inside the graphic
The main pieces are the time axis, the spending line, and the labeled points or annotations that call out the slowdown as inflation rises. The structure is simple and temporal, with the trend line carrying the comparison.
Main takeaway from the visual
The chart shows that spending did keep rising after the early pandemic shock, but not with the same strength once inflation accelerated. The slope of the line and the later flattening make the drag from higher prices visually clear.
Key standout values or extremes
The strongest contrast is between the stronger climb in the early recovery and the weaker later growth once inflation bites. The chart is built around that slowdown rather than around a single isolated point value.
Controls / sequence, when applicable
This is a static chart image with no in-chart controls to operate.
Companion media, when applicable
There is no separate companion audio or video; the chart image is the full visual on this page.