Source page: McKinsey & Company
Commentary
Smooth operator
Life Sciences
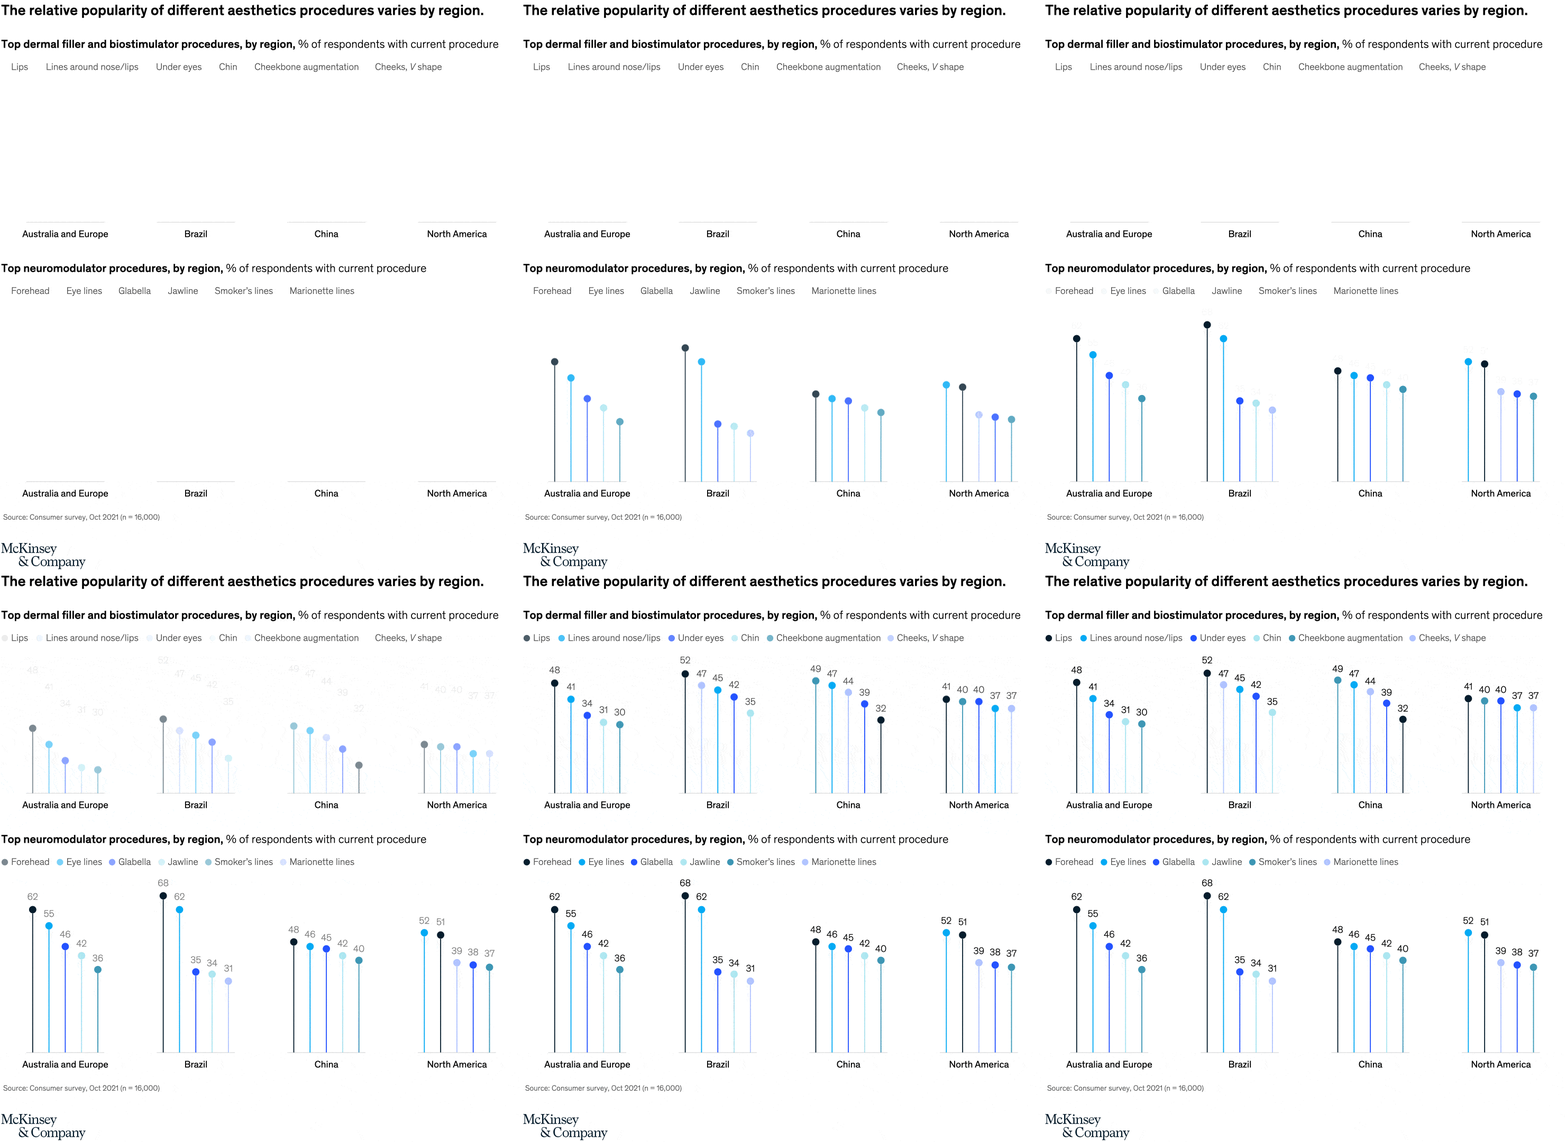
February 11, 2022 – The cultural differences among people in various regions often play into the types of aesthetic treatments that patients select, according to results of our recent consumer survey. In Brazil, for example, patients favor neuromodulator injections for the forehead, while North American patients slightly prefer the treatment for fine lines around the eyes.
To read the article, see “From extreme to mainstream: The future of aesthetics injectables,” December 20, 2021.
customizer here
Visual form
Two-panel grouped comparison chart.
Layout / body structure
The chart is split into two stacked panels, one for dermal filler and biostimulator procedures and one for neuromodulator procedures. Reader moves top to bottom between the two treatment families, and within each panel reads left to right across regions while comparing the procedure labels and their percentages.
What is being compared
The chart compares the relative popularity of specific aesthetics procedures across Australia and Europe, Brazil, China, and North America. It separates the comparison into dermal filler and biostimulator procedures on one panel and neuromodulator procedures on the other.
Measurement system
The measure is percent of respondents with the current procedure, shown directly as numeric values beside the procedure dots or labels. The same percentage framework is used across both panels, which makes it possible to compare not only regions but also how concentrated or diffuse procedure popularity is within each treatment family.
Visible structure inside the graphic
Each panel places regions across the page and stacks multiple procedure readings within each region, so the page reads as a repeated regional profile rather than one continuous line. The upper panel carries filler and biostimulator procedures such as lips, under eyes, chin, and cheek-focused work, while the lower panel carries neuromodulator procedures such as forehead, eye lines, glabella, jawline, smoker’s lines, and marionette lines.
Main takeaway from the visual
Procedure popularity varies by region rather than converging around one universal aesthetics mix. The page is built to show that certain procedures dominate in one region while others are stronger elsewhere, so regional preference differences are the core story instead of one global average ranking.
Key standout values or extremes
In the filler panel, the highest visible percentages sit in the high 40s to low 50s, including a 52 percent reading at the top end. In the neuromodulator panel, the strongest visible value is 68 percent, and many of the other leading readings cluster in the 40s to low 60s, which makes the regional spread substantial rather than trivial.
Controls / sequence, when applicable
This is a static chart image with no in-chart controls to operate.
Companion media, when applicable
There is no separate companion audio or video; the chart image is the full visual on this page.