Source page: McKinsey & Company
Commentary
Socially conscious shoppers
Retail | Diversity & Inclusion
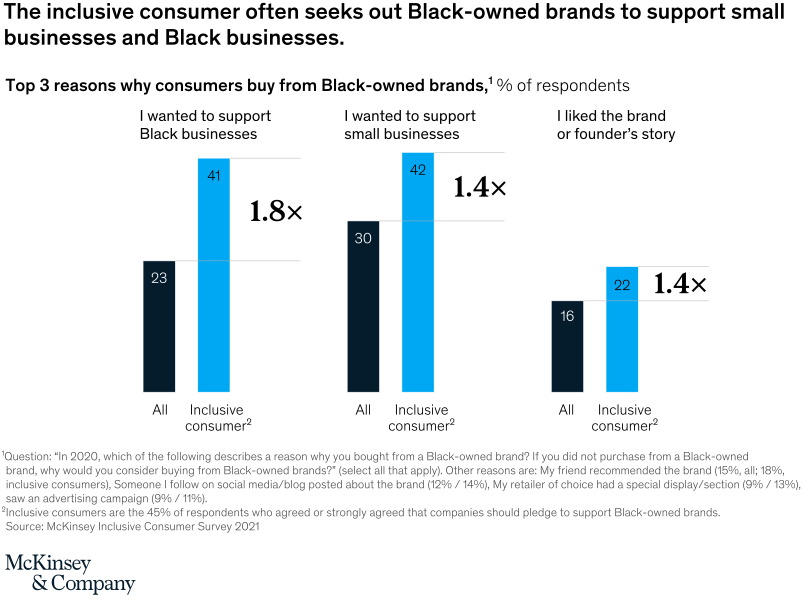
March 7, 2022 – When it comes to shopping, inclusive consumers rely more on social media, word of mouth recommendations, and are inspired by the stories of the founders behind brands they admire. They are more likely than other shoppers to buy Black-owned brands out of a desire to support diverse entrepreneurs on their growth journeys and small businesses in general.
To read the article, see “The rise of the inclusive consumer,” February 8, 2022.
customizer here
Visual form
Three-topic grouped bar chart.
Layout / body structure
The chart is organized as three side-by-side topic groups, each with one bar for all consumers and one for inclusive consumers. Reader moves left to right across the three purchase motives and compares the paired bars within each group before moving to the next reason.
What is being compared
The chart compares the top reasons consumers buy from Black-owned brands, contrasting the overall consumer sample with the subset identified as inclusive consumers. The three reasons shown are supporting Black businesses, supporting small businesses, and liking the brand or founder’s story.
Measurement system
The measure is percent of respondents selecting each reason. The bar heights carry the comparison, while the page also adds ratio callouts such as 1.4x and 1.8x to show how much more likely inclusive consumers are to select certain motives.
Visible structure inside the graphic
Each topic group contains a shorter bar for all consumers and a taller companion bar for inclusive consumers, with the percentages printed above the bars. Ratio labels hover above the groups, which turns the chart into both a direct bar comparison and a multiplier comparison for the same three motives.
Main takeaway from the visual
Inclusive consumers are more likely than the overall population to cite every visible motive for buying from Black-owned brands. The chart is especially strong on support-based motives, where the inclusive-consumer bars clearly rise above the all-consumer bars in each group.
Key standout values or extremes
Inclusive consumers register 42 percent for wanting to support Black businesses versus 30 percent for all consumers, and 41 percent for wanting to support small businesses versus 23 percent for all consumers. The largest multiplier on the page is 1.8x for the small-business motive, while liking the brand or founder’s story rises from 16 percent to 22 percent, marked as 1.4x.
Controls / sequence, when applicable
This is a static chart image with no in-chart controls to operate.
Companion media, when applicable
There is no separate companion audio or video; the chart image is the full visual on this page.