Source page: McKinsey & Company
Commentary
Socioeconomic vulnerability increases the risk of dying from COVID-19
COVID-19 | Inequality
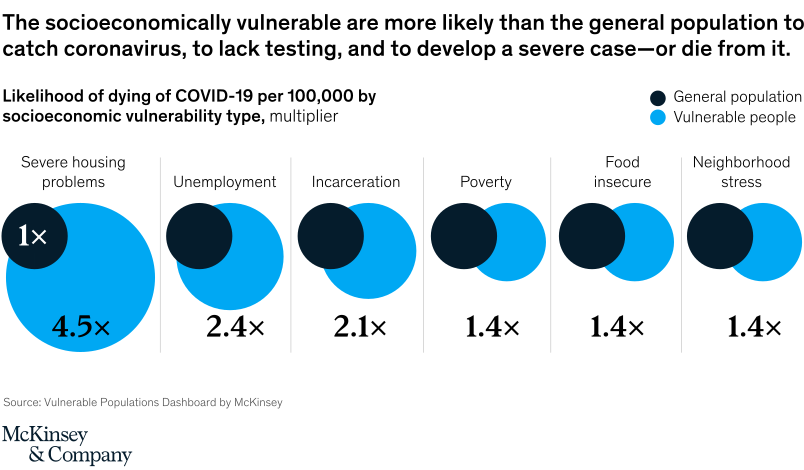
September 10, 2020 – People who have severe housing problems—or who are unemployed, incarcerated, or impoverished—are more vulnerable to contracting the novel coronavirus than the general population. They’re also more likely to have underlying health conditions that could make a case of COVID-19 more severe.
To read the report, see “US Hispanic and Latino lives and livelihoods in the recovery from COVID-19,” September 2, 2020.
customizer here
Visual form
Table (with Visual Encoding): six-category bubble comparison of COVID-19 mortality-risk multipliers.
Layout / body structure
The visual is one horizontal row of vulnerability categories. Each category pairs a small dark 1x circle for the general population with a larger blue circle for socioeconomically vulnerable people.
What is being compared
It compares the likelihood of dying from COVID-19 for the general population versus vulnerable people across severe housing problems, unemployment, incarceration, poverty, food insecurity, and neighborhood stress.
Measurement system
The measure is a risk multiplier. The general-population baseline is fixed at 1x in every category, and the vulnerable-population circle is labeled with the multiple above that baseline.
Visible structure inside the graphic
Every blue circle is larger than its paired 1x baseline circle. The size jump is strongest for severe housing problems, then smaller but still visible for unemployment, incarceration, poverty, food insecurity, and neighborhood stress.
Main takeaway from the visual
The chart shows that socioeconomic vulnerability raises COVID-19 mortality risk in every category shown, with housing insecurity creating the largest gap.
Key standout values or extremes
Severe housing problems is the largest contrast at 4.5x. Unemployment is 2.4x, incarceration is 2.1x, and poverty, food insecurity, and neighborhood stress are each 1.4x.
Controls / sequence, when applicable
This is a static visually encoded comparison table; there are no in-chart controls to operate.
Companion media, when applicable
There is no separate companion audio or video; the mortality-risk multiplier visual is the full chart on this page.