Source page: McKinsey & Company
Commentary
Software’s growth slowdown
Technology | Growth
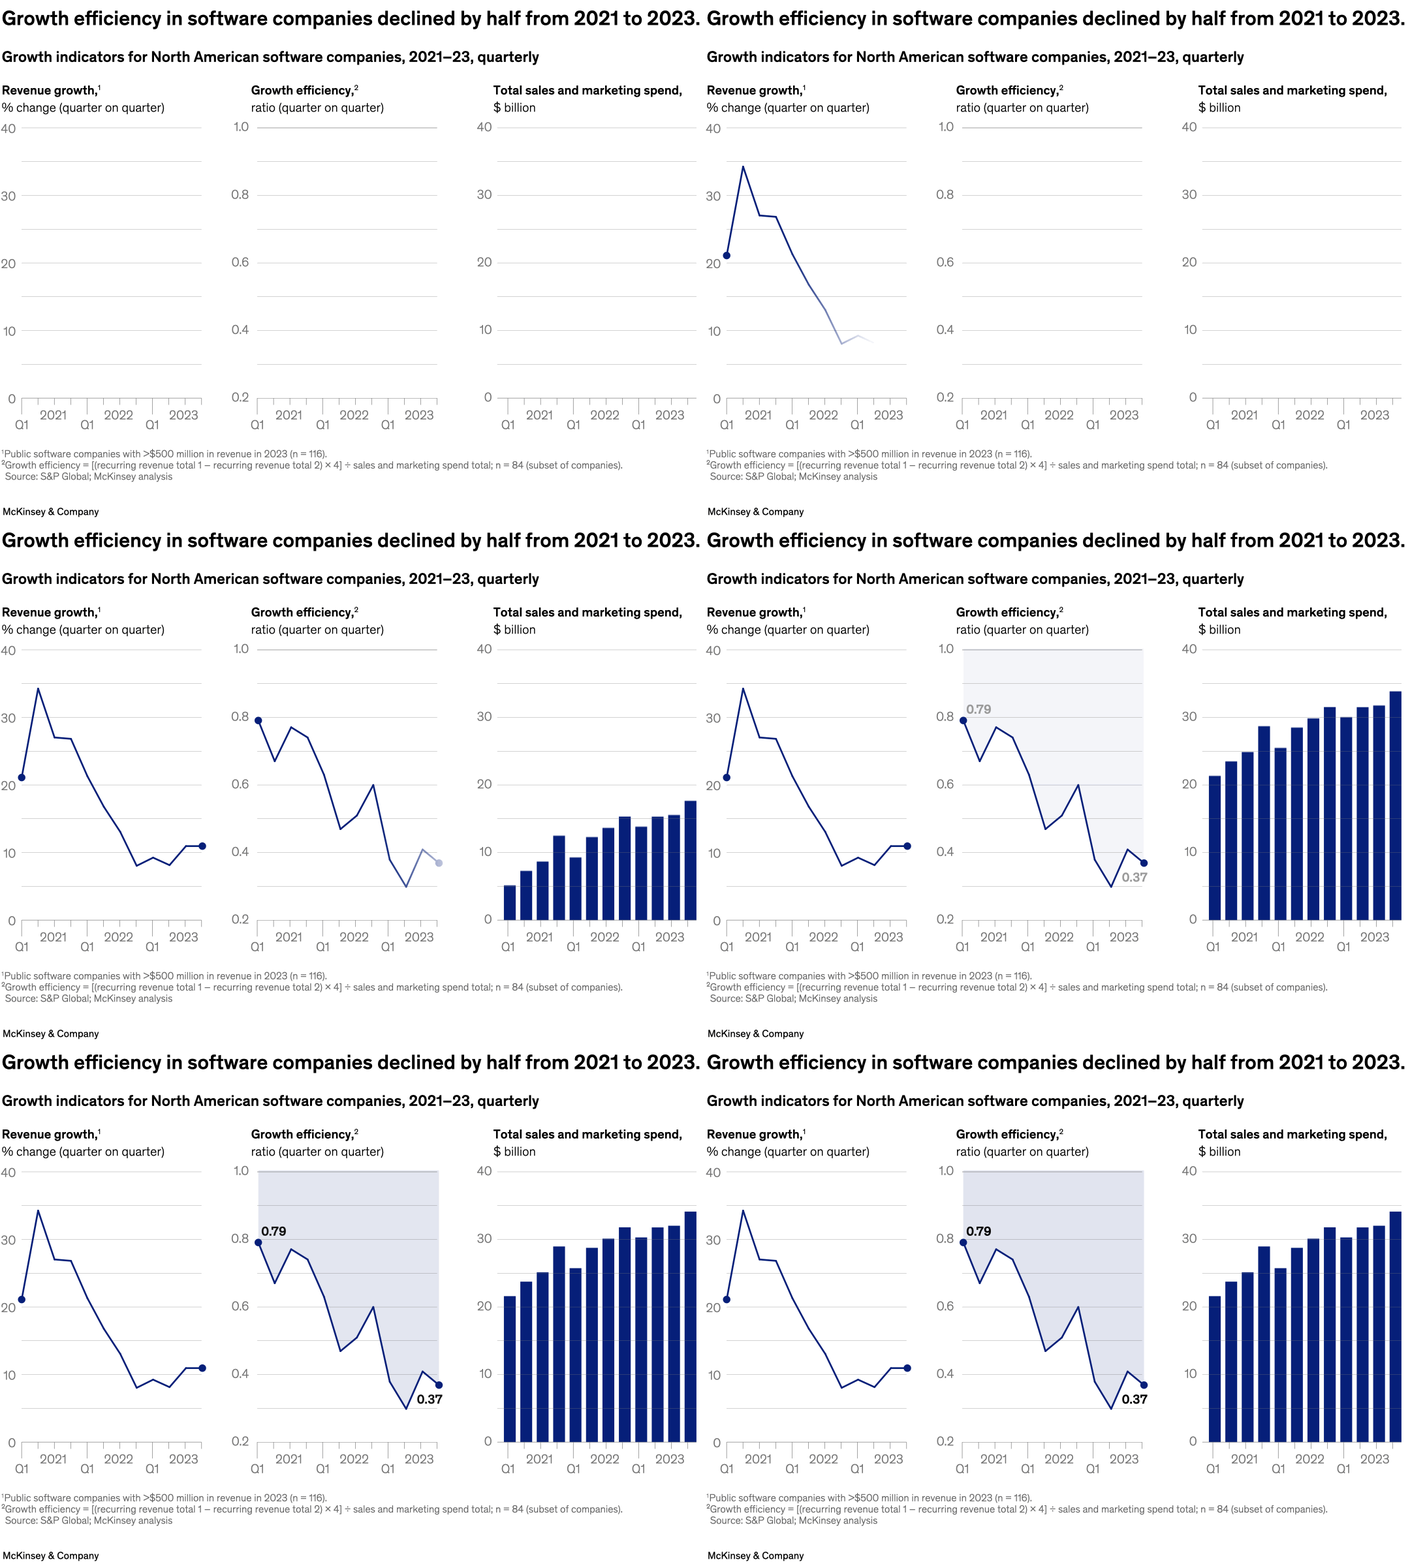
September 19, 2024 – Growth efficiency at North American software companies has taken a tumble. In recent years, these companies have faced greater competition and rising costs, resulting in a decline in global IT spending, senior partner Chandra Gnanasambandam and colleagues note. Software companies continued to invest in growth, but they were less efficient at producing new revenue, according to a McKinsey study of 116 companies. Median growth efficiency—defined as maximum growth with healthy margins—declined 50 percent from 2021 to 2023.
To read the article, see “How efficient growth can fuel enduring value creation in software,” July 29, 2024.
customizer here
Visual form
Three-panel combination chart with two line charts and one bar chart.
Layout / body structure
The chart is arranged in three side-by-side panels covering the same quarterly period from 2021 to 2023. The left panel tracks revenue growth, the middle panel tracks growth efficiency, and the right panel shows total sales and marketing spend.
What is being compared
It compares three related software-company growth indicators over time: quarterly revenue growth, quarterly growth-efficiency ratio, and aggregate sales and marketing spend.
Measurement system
The left panel uses quarter-on-quarter percentage change, the middle panel uses a ratio scale running up to 1.0, and the right panel uses billions of dollars. The shared time frame lets the viewer compare weakening growth metrics against rising commercial spending.
Visible structure inside the graphic
The left and middle panels use single lines with marked endpoints, while the right panel uses one vertical bar per quarter. The middle panel highlights the starting and ending values directly on the line, and the bar panel shows spending continuing to rise even as the other two panels weaken.
Main takeaway from the visual
The visual shows software growth becoming less efficient rather than simply slower. Revenue growth falls sharply from its early peak, growth efficiency drops even more steeply, and sales and marketing spend trends upward, so the relationship between spending and output visibly deteriorates.
Key standout values or extremes
Growth efficiency falls from 0.79 at the start of the series to 0.37 by 2023, roughly a halving. Revenue growth peaks above 30 percent early in the period and ends near 11 percent, while sales and marketing spend climbs from just above $20 billion to the low-to-mid $30 billions.
Controls / sequence, when applicable
This is a static chart image with no in-chart controls to operate.
Companion media, when applicable
There is no separate companion audio or video; the chart image is the full visual on this page.