Source page: McKinsey & Company
Commentary
Speeding toward EVs
Automotive | Electric vehicles | India
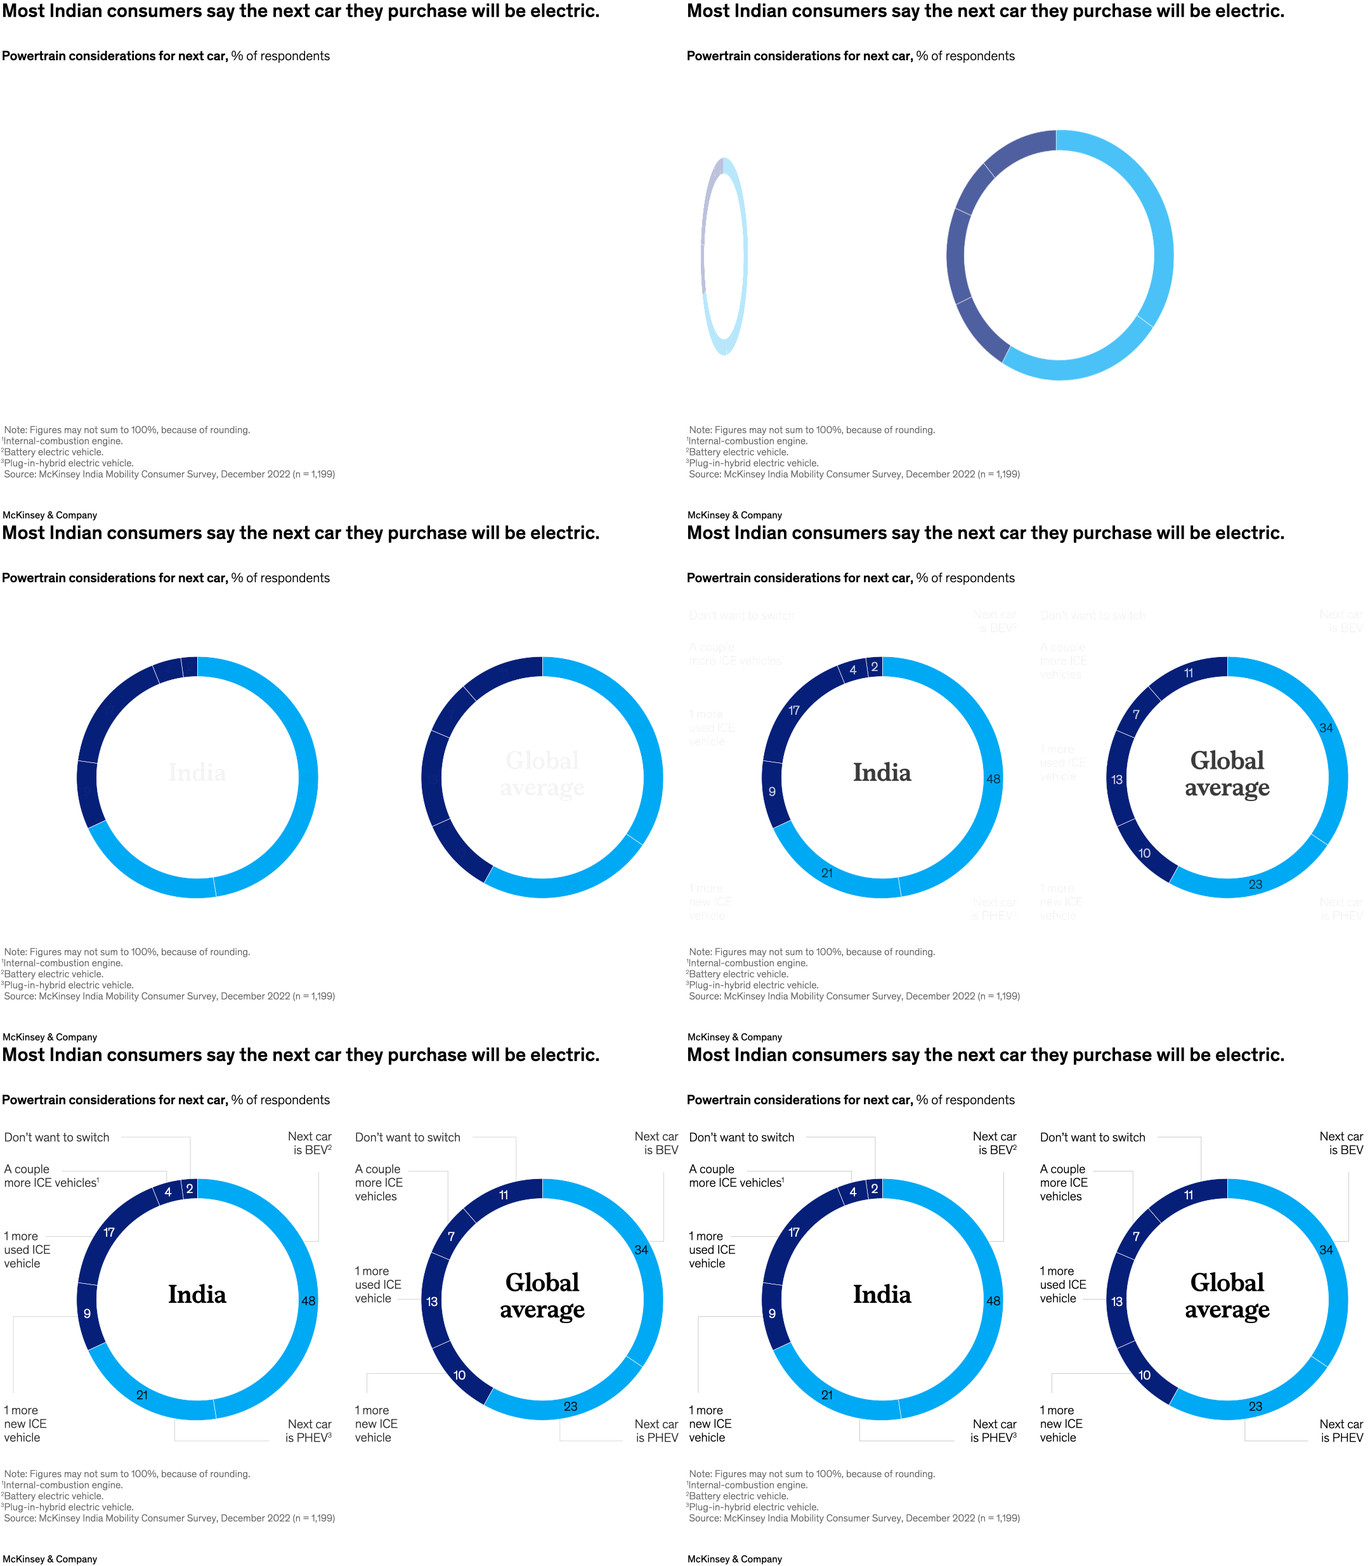
October 17, 2023 – Electric-vehicle (EV) adoption is reaching an inflection point in India, according to partner Timo Möller and coauthors. A McKinsey survey shows that most Indian consumers say they would opt for either a full battery EV or a plug-in hybrid when considering their next car. Top factors include effects on the environment, lower cost of ownership, and reduced engine noise.
To read the article, see “Consumers are driving the transition to electric cars in India,” September 14, 2023.
customizer here
Visual form
Paired segmented column chart. It compares the mix of powertrain preferences in two markets.
Layout / body structure
The chart places the India column beside a global-average column so the reader can compare the two stacks side by side. Each column is subdivided into colored segments for the different powertrain choices.
What is being compared
It compares the types of cars consumers say they would consider for their next purchase, contrasting India with the global average across powertrain options.
Measurement system
The numbers are percentages of respondents. Color separates the powertrain categories, and the total height of each column represents the full response distribution.
Visible structure inside the graphic
The graphic uses two stacked columns with segment labels placed inside or around the blocks, so the viewer can compare the mix of internal-combustion, battery-electric, plug-in-hybrid, and other options between the two markets. The side-by-side format makes share shifts visible without needing a time axis.
Main takeaway from the visual
The India stack is weighted more heavily toward electric options than the global-average stack. The visual makes the EV tilt obvious by giving more of India’s column to electric segments and less to the conventional segment than the global comparison.
Key standout values or extremes
The India column includes a large 48 percent segment and another sizable 21 percent segment, while the global-average side spreads more weight across smaller blocks such as 23, 13, 11, 10, and 7 percent. The strongest visual message is the larger combined EV share in India.
Controls / sequence, when applicable
This is a static chart image with no in-chart controls to operate.
Companion media, when applicable
There is no separate companion audio or video; the chart image is the full visual on this page.