Source page: McKinsey & Company
Commentary
Splurging during uncertainty
Consumer | Retail | Economy
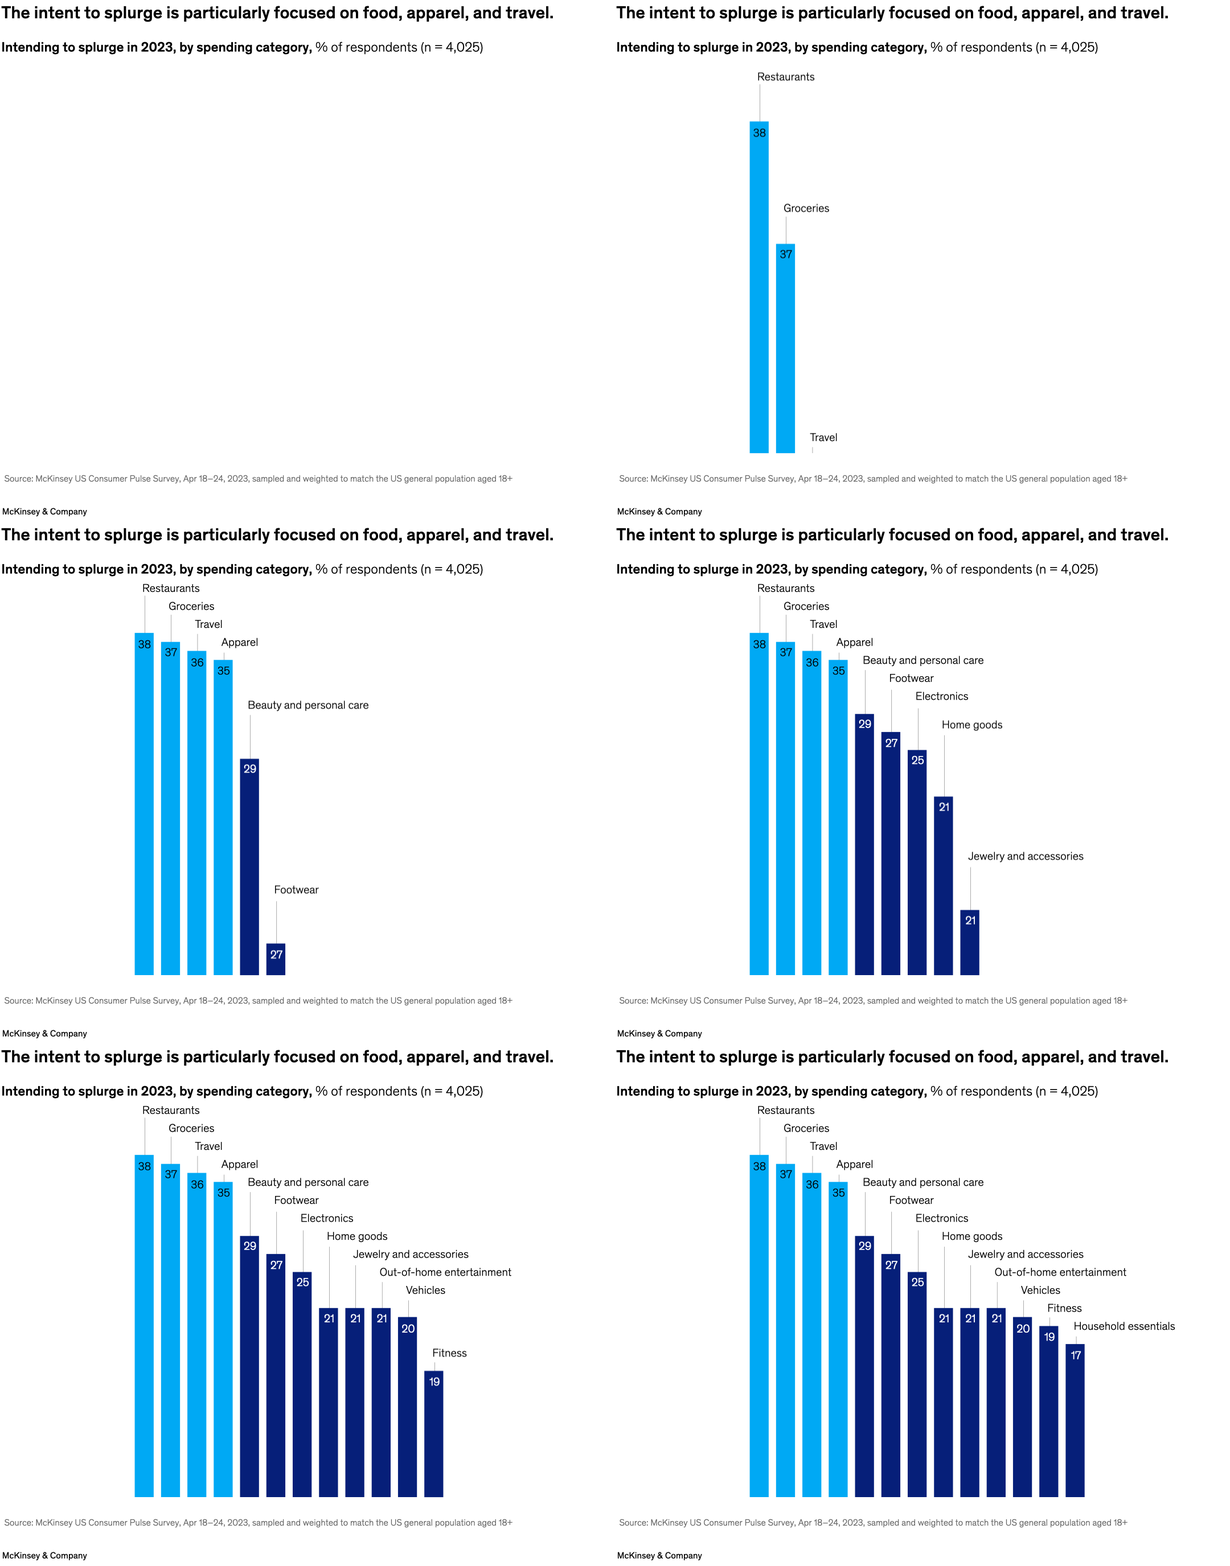
May 31, 2023 – US consumers continue to have mixed feelings about the economy, yet many still want to indulge themselves. According to research by partner Kari Alldredge and colleagues, 41 percent of consumers say they intend to splurge in 2023, with restaurants, groceries, travel, and apparel topping the list of potential indulgences. “Durable” purchases, such as household goods and jewelry, tend to rank lower on splurgy wish lists.
To read the article, see “A monthly update on the state of the US consumer: May 2023,” May 23, 2023.
customizer here
Visual form
Ranked vertical bar chart.
Layout / body structure
A single compact chart centers three vertical bars on the page, each bar labeled above the column and read left to right from the highest splurge category to the lowest among the three shown.
What is being compared
It compares the categories where consumers say they intend to splurge in 2023, focusing on restaurants, groceries, and travel in the visible frame.
Measurement system
The measure is percent of respondents, with the sample size shown in the subtitle and the exact values printed inside the bars.
Visible structure inside the graphic
Each category gets one bright-blue bar with its label above and its value inside the column, so the chart reads like a small ranked podium rather than a crowded multi-series plot.
Main takeaway from the visual
The visual makes splurging look concentrated in everyday and experience-heavy categories, with restaurants, groceries, and travel clustered closely together at the top.
Key standout values or extremes
Restaurants leads at 38 percent, groceries follows at 37 percent, and travel sits just behind at 36 percent, so the spread across the visible top three is only two percentage points.
Controls / sequence, when applicable
This is a static chart image with no in-chart controls to operate.
Companion media, when applicable
There is no separate companion audio or video; the chart image is the full visual on this page.