Source page: McKinsey & Company
Commentary
Sprinting through marathons
Digital | M&A
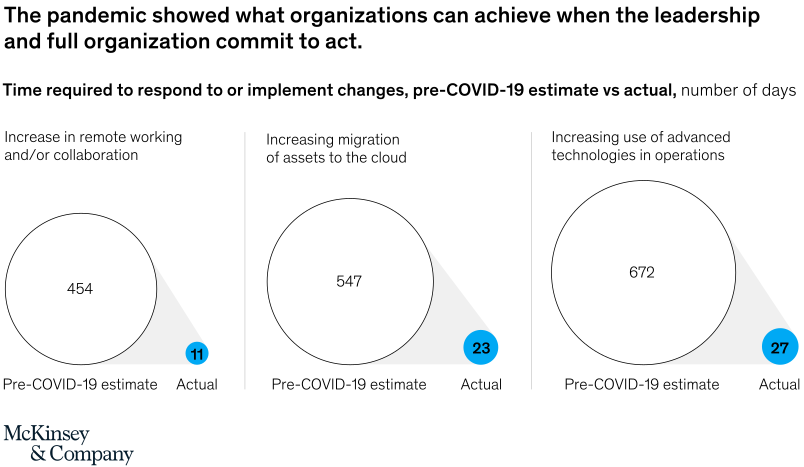
November 11, 2021 – As we’ve seen during the COVID-19 pandemic, when leaders and the organization align to act, rapid change can actually happen. This is glaringly obvious when it comes to digital M&A. Time spent on implementing changes was drastically reduced from hundreds of days to less than a month.
To read the article, see “Strategy for a digital world,” October 8, 2021.
customizer here
Visual form
Three-panel estimate-versus-actual bubble comparison chart.
Layout / body structure
The chart is laid out as three side-by-side panels for remote working and collaboration, migration of assets to the cloud, and use of advanced technologies in operations. Each panel places a very large pale estimate circle next to a much smaller blue actual circle, so the reader compares the expected and realized timelines within each initiative before moving to the next panel.
What is being compared
The chart compares pre-COVID-19 estimates for how long major digital or operating changes would take with the actual time required during the pandemic. It compares those estimate-versus-actual gaps across three transformation initiatives.
Measurement system
The unit is number of days. Each panel prints the estimated number inside the large circle and the actual number inside the small blue circle, making the chart a direct numeric comparison rather than an axis-based trend chart.
Visible structure inside the graphic
The three panels are separated by thin vertical rules and each repeats the same geometry: a huge outlined or pale estimate bubble on the left and a much smaller blue actual bubble low on the right. The printed values are 454 versus 11 for remote working and collaboration, 547 versus 23 for cloud migration, and 672 versus 27 for advanced technologies in operations.
Main takeaway from the visual
Organizations accomplished changes in days or weeks that they previously believed would take well over a year. The overwhelming difference in bubble size across all three panels makes the acceleration unmistakable, especially because every actual bubble is tiny compared with its corresponding estimate.
Key standout values or extremes
The largest estimate is 672 days for increasing use of advanced technologies in operations, compared with an actual 27 days. Remote working and collaboration drops from 454 to 11 days, and migration of assets to the cloud drops from 547 to 23 days, making the estimate-to-actual gap extreme in every panel.
Controls / sequence, when applicable
This is a static chart image with no in-chart controls to operate.
Companion media, when applicable
There is no separate companion audio or video; the chart image is the full visual on this page.