Source page: McKinsey & Company
Commentary
Squandered fortunes?
Sustainability | Decarbonization
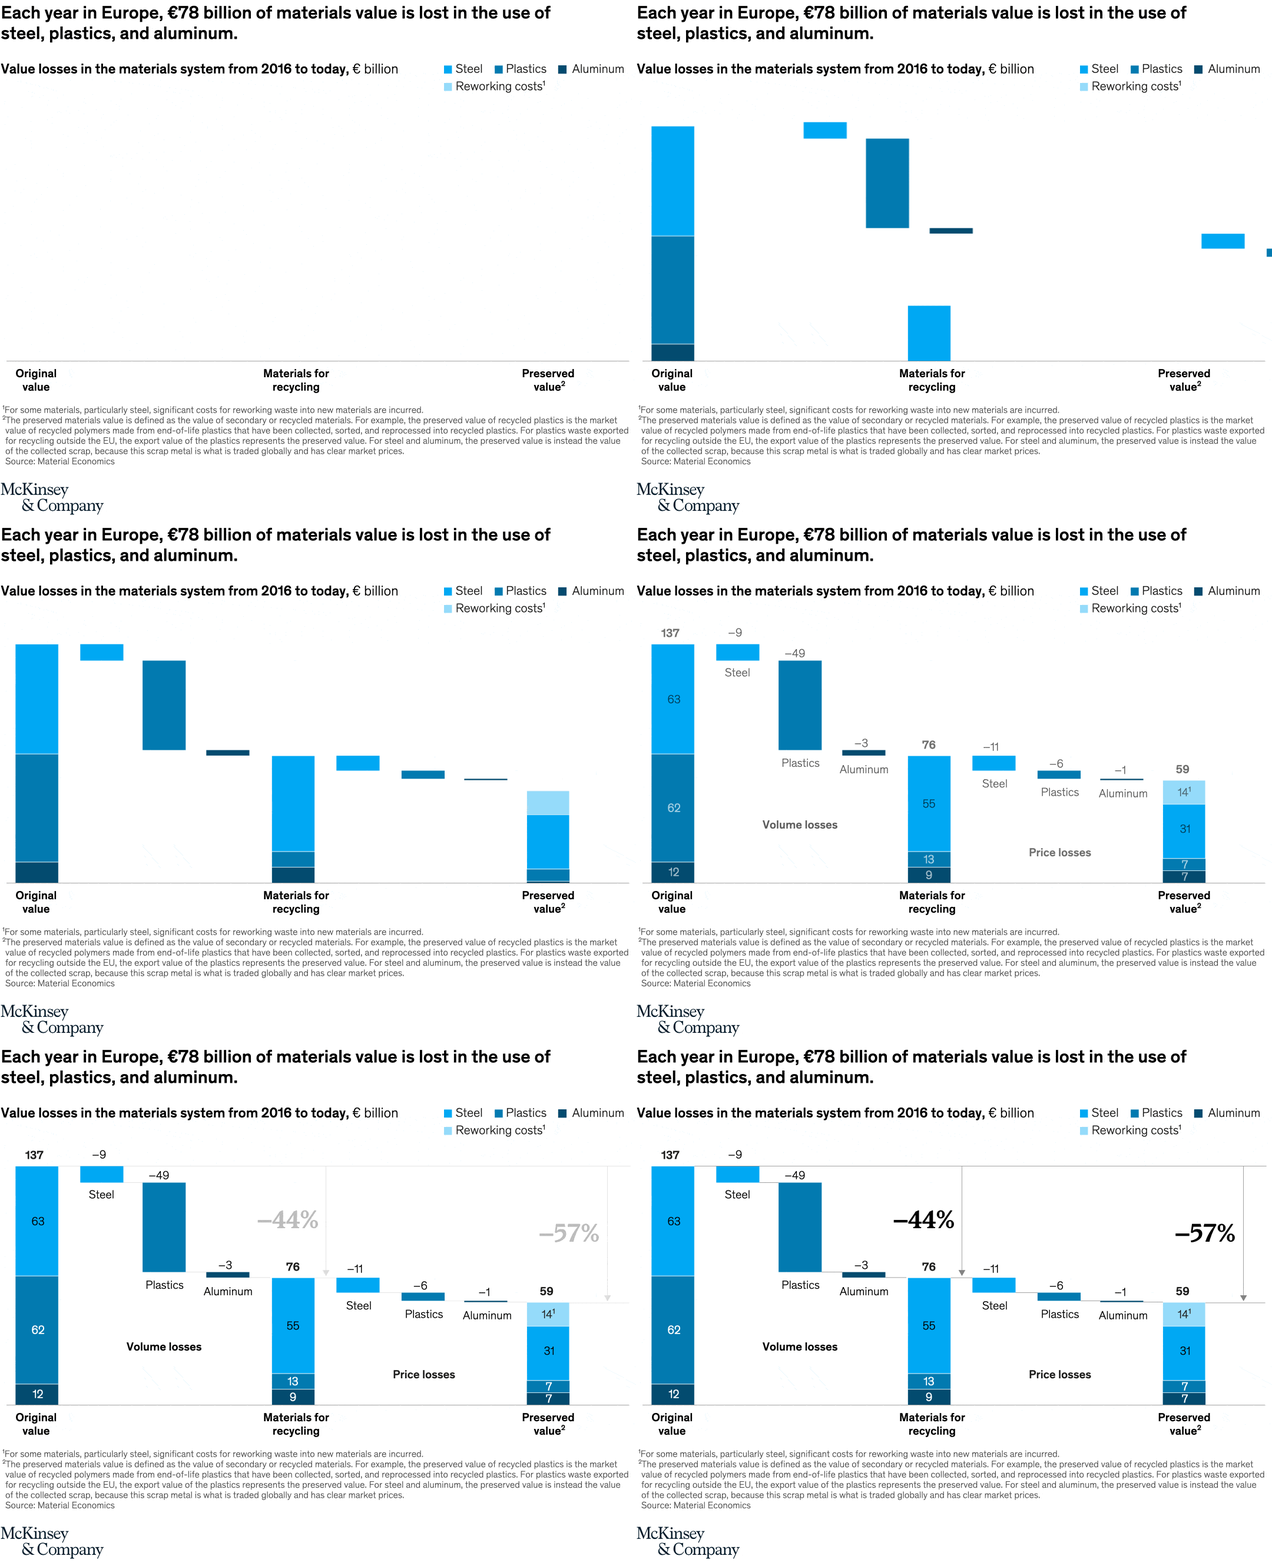
September 23, 2022 – Europe misses out on €78 billion in value from aluminum, plastics, and steel products, typically due to these materials not being recycled at all or from the products sustaining downgraded effects after a cycle of use. These lost materials could supply 64 percent of EU production for the same materials today if they made it to recycling facilities.
To read the article, see “How a ‘materials transition’ can support the net-zero agenda,” July 20, 2022.
customizer here
Visual form
Stacked bar chart.
Layout / body structure
The page presents a single central chart, read top to bottom from the headline into the material breakdown and then down to the explanatory note.
What is being compared
The chart compares lost value across major industrial materials in Europe, especially aluminum, plastics, and steel, and ties that loss to missed recycling or downcycling outcomes.
Measurement system
The reader is tracking euro-denominated value and production-equivalent material volume, so the important units are euros and the implied share of current EU production that the lost material could supply.
Visible structure inside the graphic
The chart uses segmented bars or columns to separate the contribution of each material and to show how the overall value loss is built up across the different material streams.
Main takeaway from the visual
The visual makes the missed circular-economy opportunity tangible by showing that the value leaking out of the system is large enough to matter at industrial scale, not just at the margin.
Key standout values or extremes
The key values surfaced on the page are the EUR 78 billion of lost value and the estimate that these materials could supply 64 percent of EU production for the same materials today if they reached recycling facilities.
Controls / sequence, when applicable
This is a static chart image with no in-chart controls to operate.
Companion media, when applicable
There is no separate companion audio or video; the chart image is the full visual on this page.