Source page: McKinsey & Company
Commentary
Stars in their ayes
Consumer
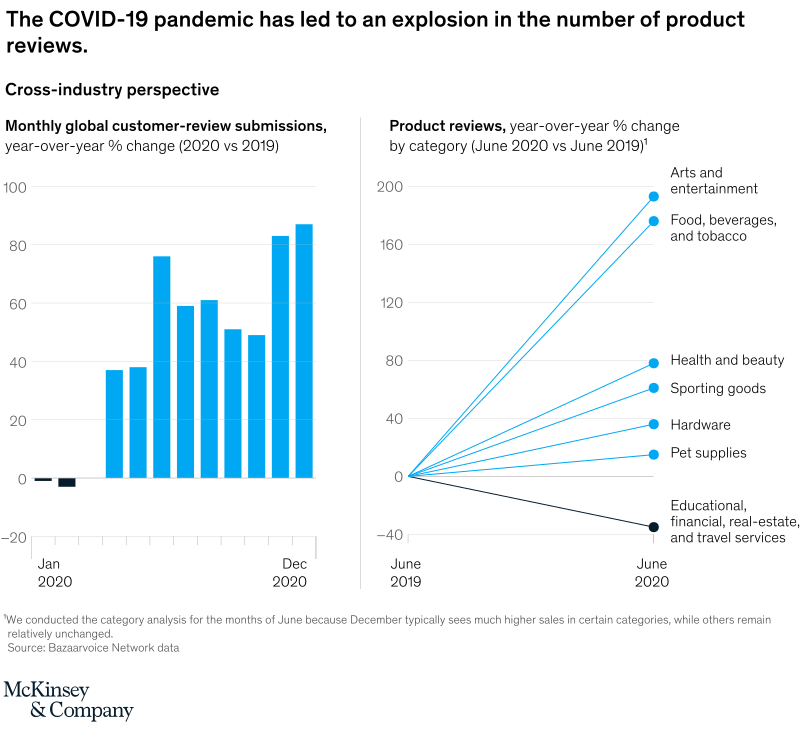
September 13, 2021 – Yes, some customer reviews are false, and yes, companies have been known to manipulate star ratings. But consumers still largely trust digital word-of-mouth. The surge in global online reviews—up by 87 percent from December 2019 to December 2020—will add to their credibility. In lockdown, customers focused on streaming services, food and beverage, and health products; out-of-home services were less reviewed.
To read the article, see “Five-star growth: Using online ratings to design better products,” August 12, 2021.
customizer here
Visual form
Two-panel comparison chart made of a monthly bar chart and a category line-and-dot chart.
Layout / body structure
The chart places two panels side by side. Read the left panel first for the month-by-month change in review submissions during 2020, then move to the right panel for the category breakout from June 2019 to June 2020.
What is being compared
The left panel compares monthly global customer-review submissions across the 2020 calendar year versus 2019, while the right panel compares year-over-year review growth across product and service categories.
Measurement system
Both panels use year-over-year percent change. The left axis runs from negative values up to about 100 percent for monthly submission growth, and the right panel uses a vertical percent scale that stretches from below zero to 200 percent for category growth, with each line ending at its June 2020 result.
Visible structure inside the graphic
The left panel is a single sequence of vertical bars from January through December 2020, beginning slightly below zero and then rising sharply through the rest of the year. The right panel is a fan of seven lines that all start at zero in June 2019 and end at labeled dots in June 2020, with the category names written directly at the right edge instead of in a separate legend.
Main takeaway from the visual
Review activity surged during the pandemic and stayed elevated, but the increase was not even across categories. Entertainment, food, and several goods categories climb sharply above the baseline, while service-heavy categories tied to travel, education, finance, and real estate move downward instead of up.
Key standout values or extremes
On the right panel, arts and entertainment rises to just under 200 percent and food, beverages, and tobacco lands in the high 170s. Health and beauty finishes around 79 percent, sporting goods around 61 percent, hardware around 36 percent, pet supplies around 15 percent, while educational, financial, real-estate, and travel services drop to roughly negative 35 percent. On the left panel, the strongest monthly bars reach the mid-80s by late 2020 after slightly negative readings at the start of the year.
Controls / sequence, when applicable
This is a static chart image with no in-chart controls to operate.
Companion media, when applicable
There is no separate companion audio or video; the chart image is the full visual on this page.