Source page: McKinsey & Company
Commentary
Stayin' alive and well
Public Health
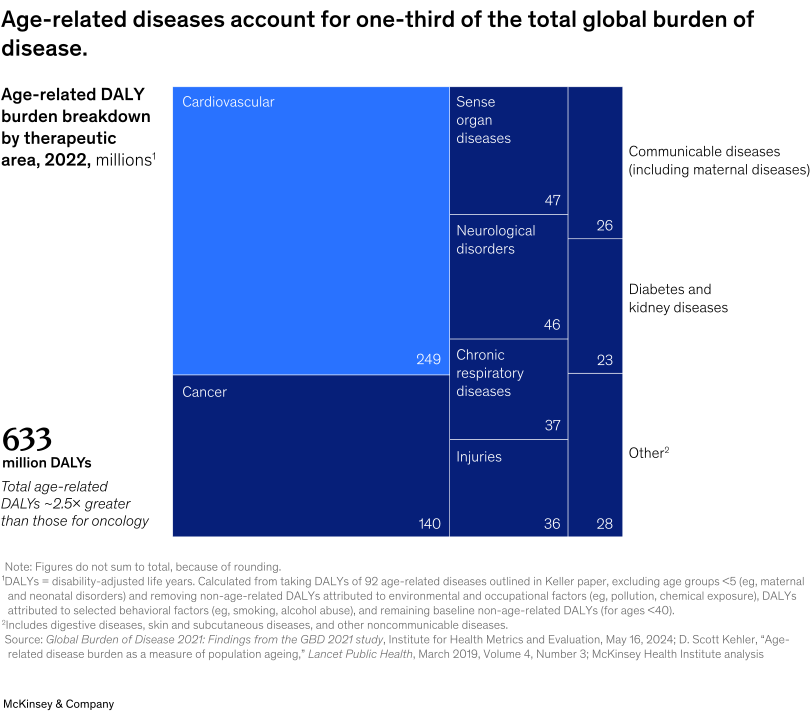
October 15, 2025 – Enabling people to live healthier for longer is increasingly important, with societies facing demographic shifts. Almost 15 percent of the global population is expected to be 65 or older by 2040, up from 10 percent today. This underscores the imperative to focus not only on extending lifespan but also healthspan, or increasing the number of years people spend in good health, explain Senior Partner Hemant Ahlawat and coauthors. Age-related diseases and conditions account for one-third of the total global burden of disease, or approximately 633 million disability-adjusted life years (DALYs) annually, according to analysis from the McKinsey Health Institute. Reducing this burden by half could prevent early deaths, improve health in later life, and potentially add $2 trillion to the annual GDP through increased workforce participation.
To read the report, see “Healthspan science may enable healthier lives for all,” August 29, 2025.
customizer here
Visual form
Treemap-style burden-of-disease breakdown chart.
Layout / body structure
The visual is a single treemap that reads by relative area, with a large left block for the biggest categories and narrower stacked blocks on the right for smaller therapeutic areas. A large total callout sits to the left of the treemap and the disease labels are written directly inside or beside the rectangles.
What is being compared
It compares the age-related DALY burden across therapeutic areas in 2022, showing how much of the total age-related disease burden each major disease cluster represents.
Measurement system
The values are measured in millions of DALYs. Rectangle size reflects the relative burden, and many of the blocks are labeled directly with their numeric values so the reader can compare the major disease groups.
Visible structure inside the graphic
Cardiovascular disease occupies the largest rectangle, cancer forms the large block beneath it, and the right side stacks smaller categories such as sense-organ diseases, neurological disorders, chronic respiratory diseases, injuries, communicable diseases, diabetes and kidney diseases, and other. The left margin total box anchors the full burden figure.
Main takeaway from the visual
Age-related disease burden is broad, but it is heavily concentrated in cardiovascular disease and cancer, with several smaller chronic conditions adding substantial burden on top of those two dominant areas.
Key standout values or extremes
The total callout is 633 million DALYs. Cardiovascular disease is the largest block at 249, cancer is next at 140, and the next tier includes sense-organ diseases at 47, neurological disorders at 46, chronic respiratory diseases at 37, and injuries at 36, while the smallest labeled blocks on the right are in the low-to-mid 20s.
Controls / sequence, when applicable
This is a static chart image with no in-chart controls to operate.
Companion media, when applicable
There is no separate companion audio or video; the chart image is the full visual on this page.