Source page: McKinsey & Company
Commentary
Steady spending in Europe
Consumer | Europe | Retail
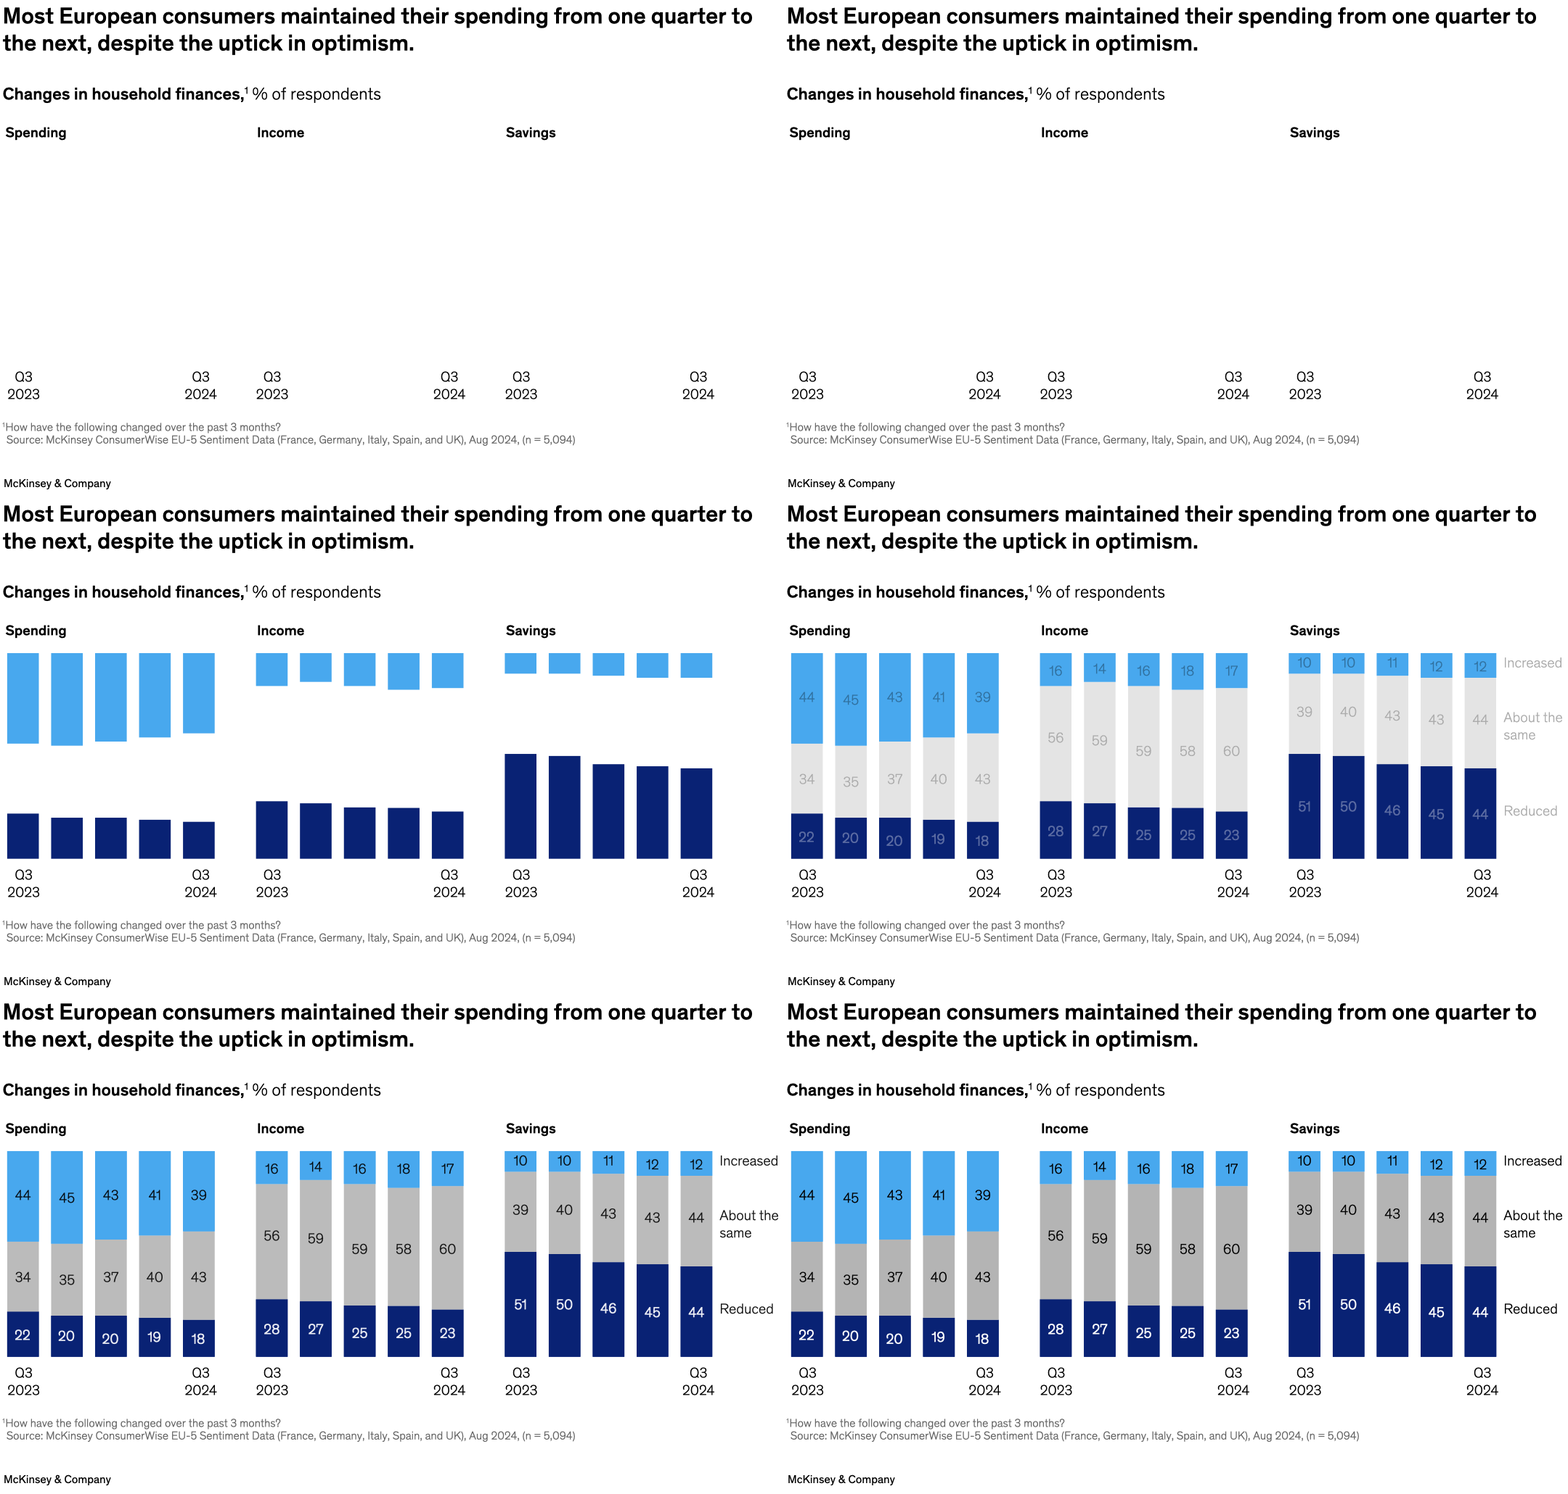
October 23, 2024 – Despite a more positive outlook among European consumers, their spending habits remain largely unchanged from the previous quarter, with many continuing to implement savings strategies. Forty-three percent of respondents to a recent McKinsey survey said they had maintained the amount they spent compared with the previous three months, senior partner Jessica Moulton and colleagues note; this proportion is just 3 percentage points higher than at the end of the second quarter. As they had three months ago, a third of consumers indicated they were still carefully tracking expenses and dipping into savings to cover needs.
To read the article, see “An update on European consumer sentiment: Steady spending over the summer,” September 9, 2024.
customizer here
Visual form
Stacked vertical bar chart.
Layout / body structure
The chart is a single chart organized into three grouped clusters for Spending, Income, and Savings. Within each cluster, five quarterly bars run from Q3 2023 through Q3 2024, so the page is read left to right across household measures and then across time within each group.
What is being compared
It compares how European consumers say their spending, income, and savings changed over five survey points, splitting each bar into increased, about the same, and reduced responses.
Measurement system
The reader tracks respondent shares in percent, shown as stacked segments inside each bar. Color separates increased, unchanged, and reduced responses, and the group labels identify which household measure each set of bars belongs to.
Visible structure inside the graphic
Each cluster contains five stacked columns, with the middle and largest segment often labeled for the share saying things stayed about the same. The repetition of the same three-color stack across all fifteen bars makes it easy to compare the balance between growth, stability, and decline in each household measure.
Main takeaway from the visual
The dominant visual pattern is stability: the unchanged segment is the largest part of the spending and income bars by the end of the period, while the reduced-savings segment shrinks over time. The chart shows consumers holding spending steadier even as savings behavior remains more strained than income.
Key standout values or extremes
In spending, the share saying their outlays were about the same rises from 34 to 43 percent while the reduced share falls from 22 to 18 percent. In savings, reduced remains the largest segment, but it still eases from 51 to 44 percent, and the increased-savings segment edges up from 10 to 12 percent.
Controls / sequence, when applicable
This is a static chart image with no in-chart controls to operate.
Companion media, when applicable
There is no separate companion audio or video; the chart image is the full visual on this page.