Source page: McKinsey & Company
Commentary
Steps to manage methane
Decarbonization | Oil & Gas
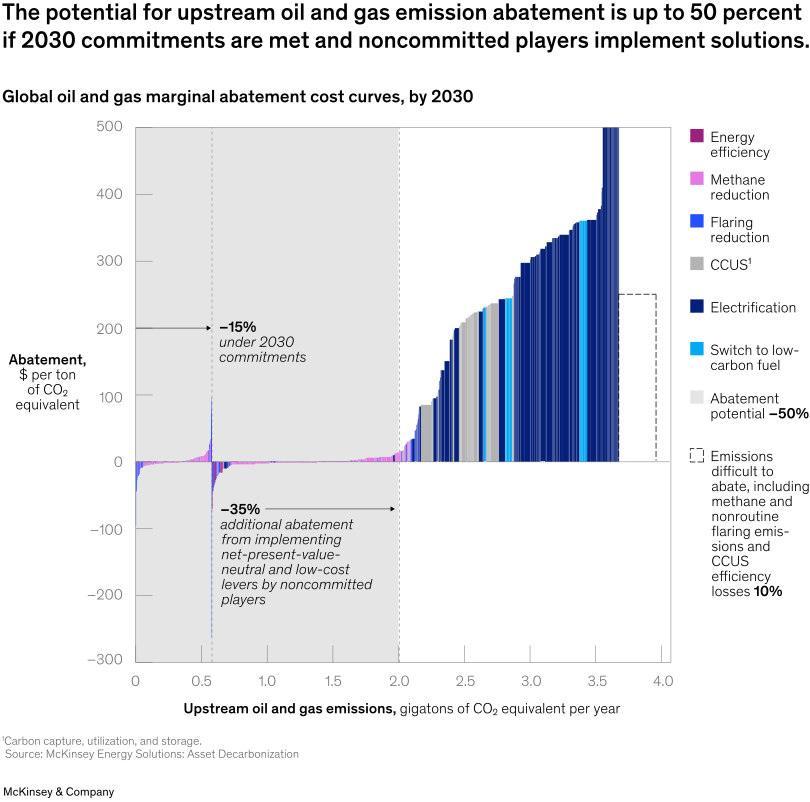
February 4, 2025 – The upstream oil and gas sector could possibly cut its emissions by 50 percent by 2030 through implementing cost-effective measures such as leaked gas recovery. This figure includes existing commitments, which account for 15 percent of methane abatement, plus a further 35 percent reduction with efforts by noncommitted players, Senior Partner Namit Sharma and coauthors note. Roughly 10 percent of total emissions are challenging to address, however, including a proportion of methane leaks and nonroutine flaring.
To read the article, see “The true cost of methane abatement: A crucial step in oil and gas decarbonization,” November 21, 2024.
customizer here
Visual form
Bar Chart: marginal abatement cost curve for upstream oil and gas emissions-reduction levers.
Layout / body structure
The chart is a wide sequence of narrow vertical bars sorted from lower-cost abatement on the left to higher-cost abatement on the right. Annotations divide the curve into committed abatement, additional low-cost opportunity, and the hard-to-abate tail.
What is being compared
It compares upstream oil and gas abatement levers by emissions volume and cost per ton of CO2 equivalent, including energy efficiency, methane reduction, flaring reduction, CCUS, electrification, and lower-carbon fuel switching.
Measurement system
The horizontal scale is gigatons of CO2 equivalent per year. The vertical scale is dollars per ton of CO2 equivalent, with bars extending below zero for negative-cost opportunities and rising high above zero for expensive residual abatement.
Visible structure inside the graphic
Dense colored bars form a rising cost curve. The left side contains low- and negative-cost levers, the middle marks additional neutral-to-low-cost opportunity, and the far-right boxed section shows a steep hard-to-abate tail.
Main takeaway from the visual
The chart shows that upstream oil and gas can address a large share of emissions with low-cost or value-neutral measures before reaching the small but costly residual segment.
Key standout values or extremes
The chart marks 15 percent abatement under 2030 commitments and an additional 35 percent from broader low-cost and net-present-value-neutral implementation, for a 50 percent potential reduction. The hard-to-abate tail is about 10 percent and rises to roughly $500 per ton at the far right.
Controls / sequence, when applicable
This is a fixed marginal-cost bar chart; there are no in-chart controls to operate.
Companion media, when applicable
There is no separate companion audio or video; the methane-abatement cost curve is the visual on this page.