Source page: McKinsey & Company
Commentary
Still struggling: Not enough women in the C-suite
Diversity & Inclusion | Inequality
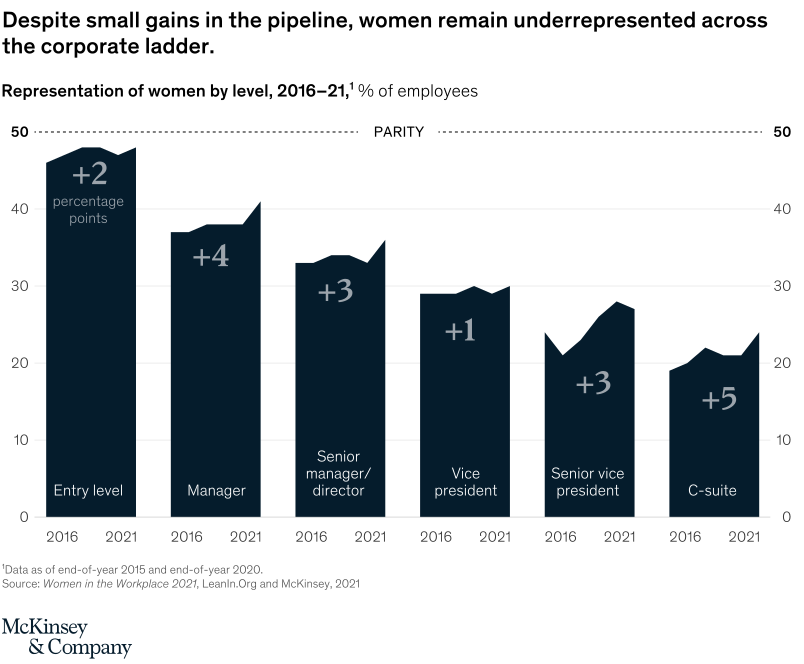
October 15, 2021 – From entry-level to the C-suite, women remain underrepresented in corporate America. Although women made representation gains of five percentage points in leadership roles in the past five years, they still make up less than 25 percent of executive-level positions, according to McKinsey’s joint report with LeanIn.Org, Women in the Workplace 2021.
To read the article, see “Women in the Workplace 2021,” September 27, 2021.
customizer here
Visual form
Single-panel stepped bar-and-area ladder chart.
Layout / body structure
The chart is a single chart that runs left to right across six corporate levels, from entry level through the C-suite. Each level is drawn as a dark stepped block with a 2016 value on the left edge, a 2021 value on the right edge, and a large change label inside the shape.
What is being compared
The chart compares the representation of women at six levels of the corporate ladder over time: entry level, manager, senior manager or director, vice president, senior vice president, and C-suite. It is a role-by-role progression comparison as well as a before-versus-after comparison between 2016 and 2021.
Measurement system
The measurement is the percentage of employees who are women at each level, plotted on a 0 to 50 percent vertical scale. A dashed parity line at 50 percent runs across the top to show how far each level remains below even representation.
Visible structure inside the graphic
Six separate dark blocks step across the page, each with the role name at the base and the 2016 and 2021 endpoints printed below the two sides. Large interior annotations such as +2, +4, +3, +1, +3, and +5 summarize the change in percentage points for each rung.
Main takeaway from the visual
The chart shows small gains at every rung of the ladder, but women remain underrepresented everywhere and the upper levels stay much farther from parity than the entry level. The visual makes the pipeline look only mildly improved rather than structurally repaired.
Key standout values or extremes
Entry level sits just under parity and rises by 2 percentage points, managers gain 4 points, senior managers or directors gain 3, vice presidents gain only 1, senior vice presidents gain 3, and the C-suite gains 5 but still ends in the low 20s. The C-suite remains the lowest level shown, while entry level is the highest and closest to the 50 percent line.
Controls / sequence, when applicable
This is a static chart image with no in-chart controls to operate.
Companion media, when applicable
There is no separate companion audio or video; the chart image is the full visual on this page.