Source page: McKinsey & Company
Commentary
Stream, shop, repeat
E-commerce | Marketing & Sales | Retail
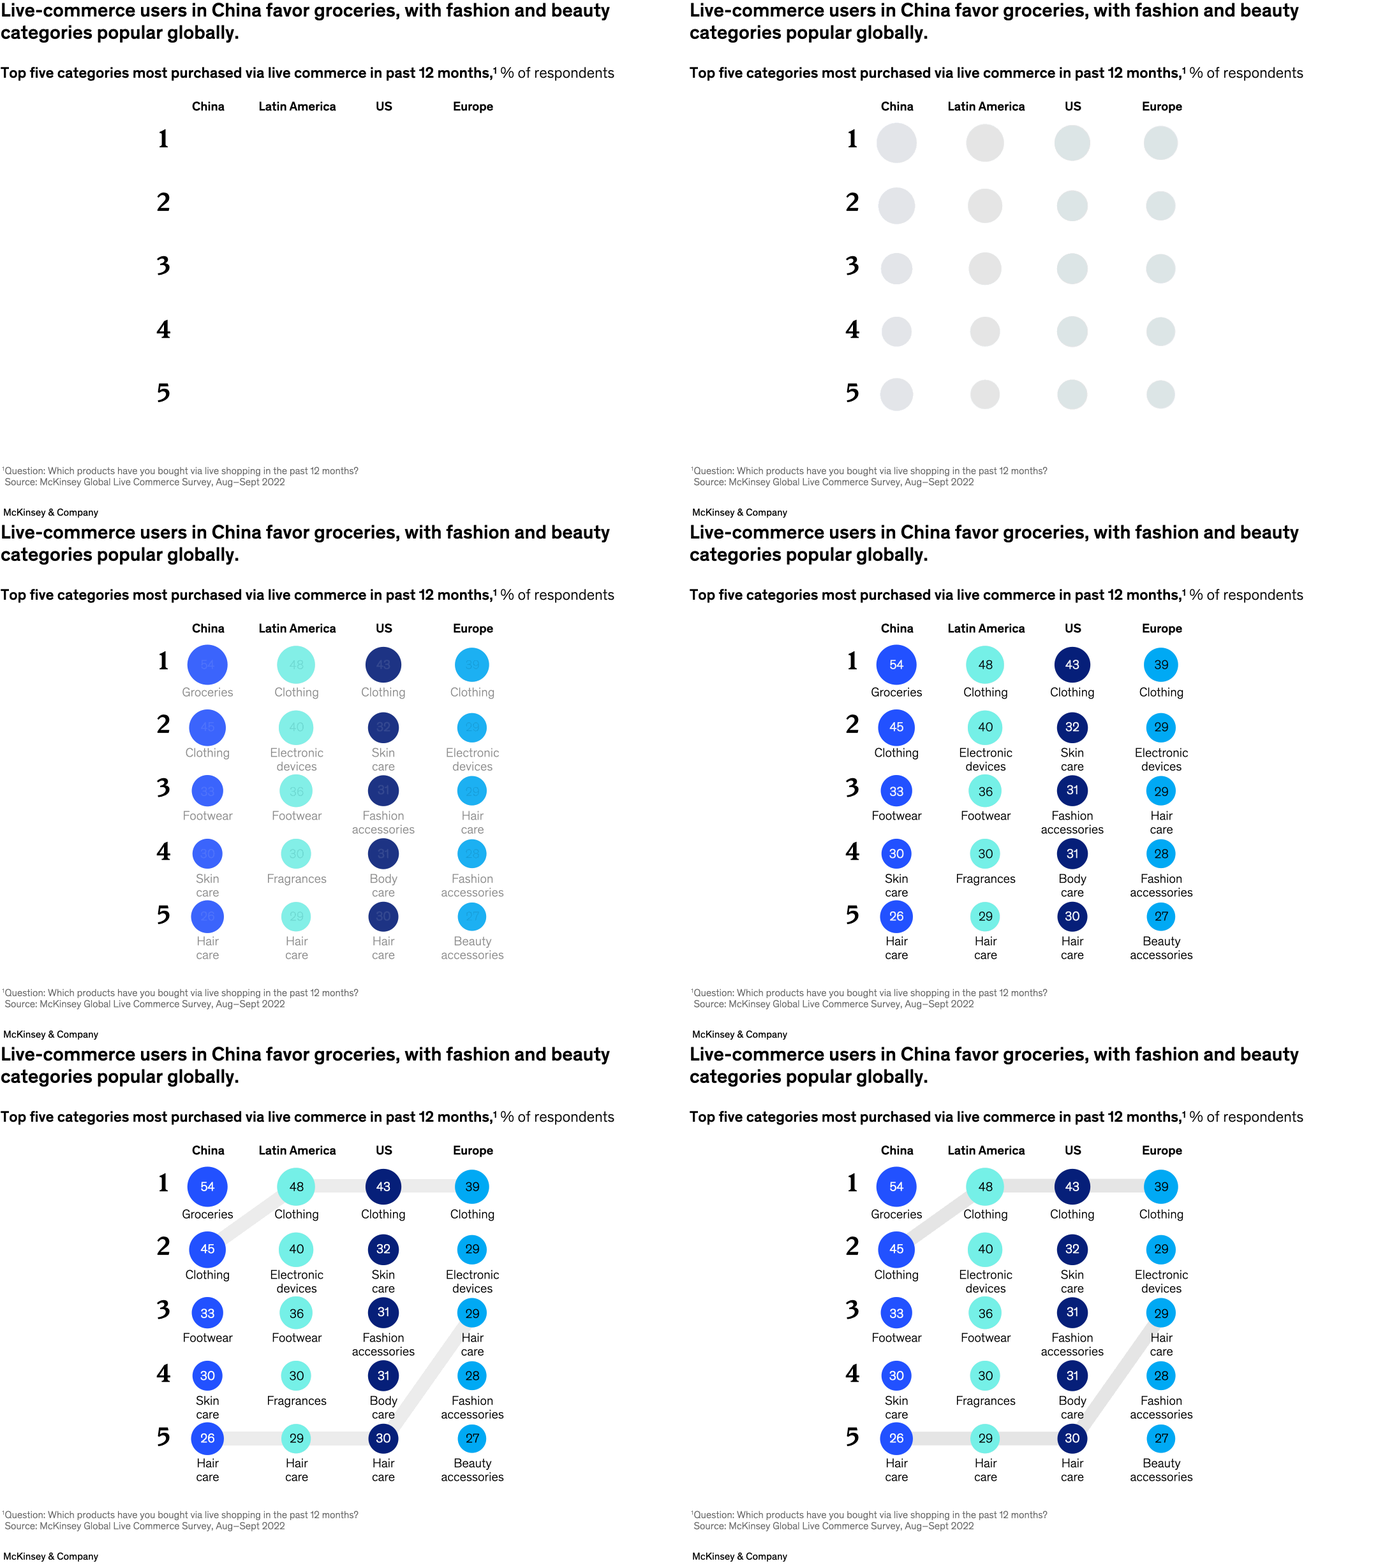
August 15, 2023 – Consumer interest in live commerce—which enables real-time product purchasing and interaction with a host during a live video event—continues to grow. Senior partners Kevin Wei Wang and Stephan Zimmermann and coauthors find that in China, the most mature of all live-commerce markets, groceries were the category most purchased by live-commerce users during the past 12 months, a trend accelerated by the COVID-19 pandemic. Clothing topped the list for Latin America, the United States, and Europe.
To read the article, see “Ready for prime time? The state of live commerce,” July 7, 2023.
customizer here
Visual form
Ranked multi-column comparison table.
Layout / body structure
The visual is organized into four vertical market columns – China, Latin America, the United States, and Europe – with ranks one through five running downward in each column.
What is being compared
It compares the top five product categories most purchased via live commerce in the past twelve months across the four regional markets.
Measurement system
The measure is percent of respondents, with each rank slot pairing a category label and a numeric share inside its market column.
Visible structure inside the graphic
Each column has ordered ranks, category names, and colored percentages, so the reader can compare both the within-market order and the cross-market category mix at the same time.
Main takeaway from the visual
China stands out for grocery-led live-commerce demand, while clothing and beauty-related categories dominate more strongly in the other regions.
Key standout values or extremes
The clearest visible extreme is groceries in China at 54 percent, while the top-ranked categories in the other regions cluster lower, in the 30s and 40s.
Controls / sequence, when applicable
This is a static chart image with no in-chart controls to operate.
Companion media, when applicable
There is no separate companion audio or video; the chart image is the full visual on this page.