Source page: McKinsey & Company
Commentary
Supply chain inventory inertia
Supply Chain Management
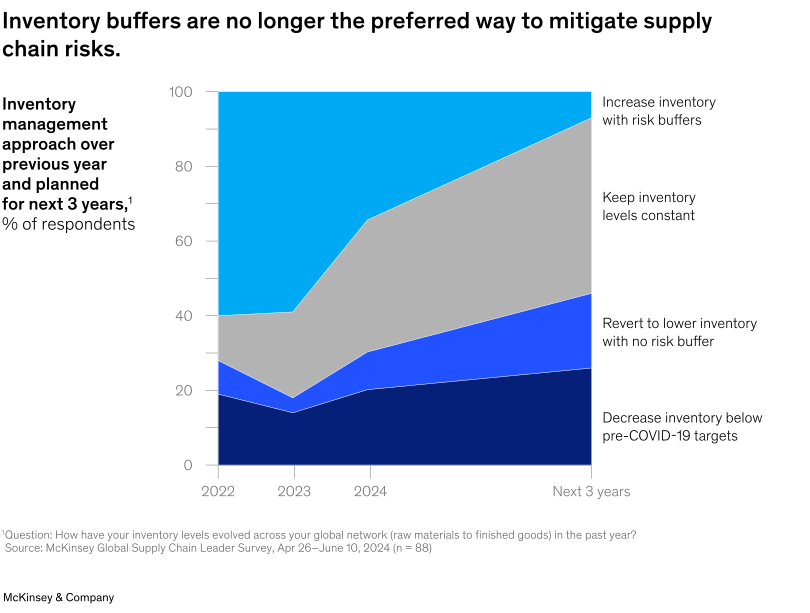
December 3, 2024 – 2020 marked a year of unparalleled supply chain chaos largely due to the COVID-19 pandemic. However, disruptions still persist and, worryingly, many companies seem to be easing their focus on supply chain resilience, say partner Knut Alicke and coauthors. For example, in the latest McKinsey Global Supply Chain Leader Survey, while 47 percent of respondents plan to maintain current inventory levels, 46 percent anticipate decreasing or nixing risk buffers, with inventories dropping to or below prepandemic levels. Only 7 percent intend to up network inventory.
To read the article, see “Supply chains: Still vulnerable,” October 14, 2024.
customizer here
Visual form
Stacked area chart.
Layout / body structure
The visual is a single layered area chart running from 2022 to 2023 to 2024 and then forward to the next three years. Read left to right through time, watching how the thickness of each colored band changes as the preferred inventory-management approach shifts.
What is being compared
It compares four inventory-management approaches over time: decreasing inventory below pre-COVID-19 targets, reverting to lower inventory with no risk buffer, keeping inventory levels constant, and increasing inventory with risk buffers. The chart shows how preference shifts away from extra inventory and toward steadier or leaner approaches.
Measurement system
The vertical axis is measured as percentage of respondents, so the stacked layers sum to 100 percent at each point in time. Color differentiates the four management approaches and the right-side labels name each band at the forecast endpoint.
Visible structure inside the graphic
The chart is built from four colored areas stacked on top of one another, with each layer widening or narrowing as time progresses. The top bright-blue layer for increasing inventory with buffers shrinks sharply, while the lower dark and gray layers expand toward the right edge of the chart.
Main takeaway from the visual
The visual shows that inventory buffers are losing favor as the preferred supply-chain risk response. Over time, the share planning to increase inventory with risk buffers falls dramatically, while keeping inventory constant and reducing inventories gain more space in the stack.
Key standout values or extremes
The top buffer-heavy approach occupies about 60 percent of the stack in 2022 and 2023, but shrinks to roughly one-third in 2024 and to only a small sliver around 8 percent in the next-three-years forecast. Over the same span, keeping inventory levels constant grows to the largest band at roughly the mid-40s, while decreasing inventory below pre-COVID-19 targets and reverting to lower inventory with no risk buffer together rise to nearly half of the projected stack.
Controls / sequence, when applicable
This is a static chart image with no in-chart controls to operate.
Companion media, when applicable
There is no separate companion audio or video; the chart image is the full visual on this page.