Source page: McKinsey & Company
Commentary
Tackling the sports media divide
Sports | Marketing & Sales
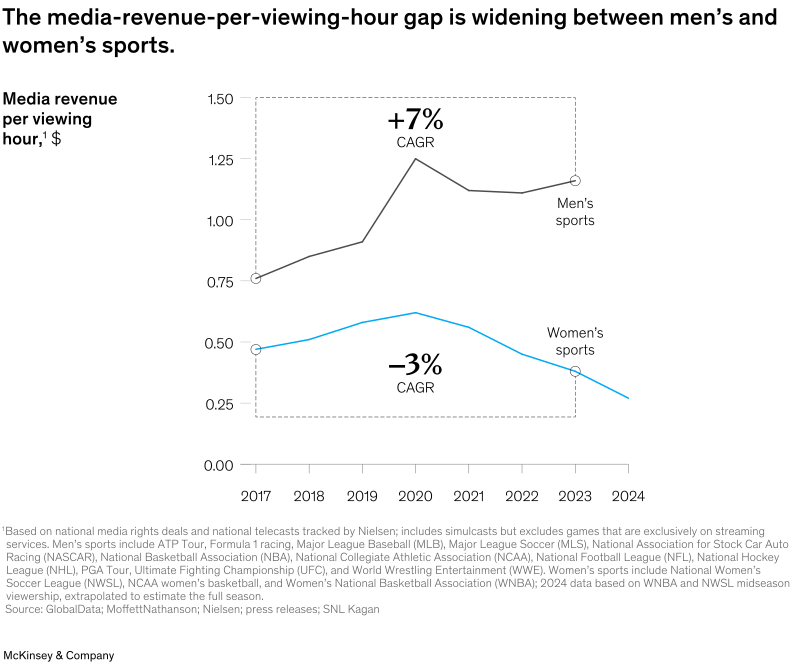
October 22, 2025 – Women’s sports in the United States are reaching an inflection point, with faster growth in fandom, viewership, and sponsorships. There remains a large monetization gap, however, compared with men’s sports, explain Senior Partner Eric Kutcher and coauthors. Although media rights have surged in recent years, women’s sports are still undervalued on a revenue-per-viewing-hour basis. Men’s sports have seen a CAGR of 7 percent in media revenue per viewing hour from 2017 to 2023, while women’s sports have had a negative CAGR of 3 percent during the same period. Considering that women’s sports have maintained viewership, there is significant headroom for rights holders to increase the cost of media rights for televised women’s sports.
To read the article, see “Closing the monetization gap in women’s sports: A $2.5 billion opportunity,” August 20, 2025.
customizer here
Visual form
Two-series line chart comparing media revenue per viewing hour for men’s and women’s sports.
Layout / body structure
The visual is a single chart with two labeled lines running from 2017 toward 2024. It reads left to right across time, with CAGR callouts placed in the middle of the chart and direct labels for men’s sports and women’s sports near the right side.
What is being compared
It compares media revenue earned per viewing hour for men’s sports versus women’s sports over time.
Measurement system
The vertical axis is dollars per viewing hour, and the horizontal axis is annual time from 2017 forward. The chart also includes CAGR callouts to summarize the direction and pace of change across the period.
Visible structure inside the graphic
A dark line for men’s sports runs in the upper half of the chart and rises to a peak before easing slightly, while a bright blue line for women’s sports sits lower, rises modestly into 2020, and then declines toward the right side. Open-circle markers highlight the line endpoints used in the comparison frame.
Main takeaway from the visual
The gap between men’s and women’s sports revenue per viewing hour is widening because the men’s series trends upward overall while the women’s series moves down after its earlier peak.
Key standout values or extremes
The men’s line rises from roughly $0.75 per viewing hour to a little above $1.1, with a +7 percent CAGR callout. The women’s line starts near $0.47, peaks a little above $0.6 around 2020, and falls toward about $0.27 by 2024, with a -3 percent CAGR callout.
Controls / sequence, when applicable
This is a static chart image with no in-chart controls to operate.
Companion media, when applicable
There is no separate companion audio or video; the chart image is the full visual on this page.