Source page: McKinsey & Company
Commentary
Taking the pulse of life insurance
Financial services | Asia-Pacific
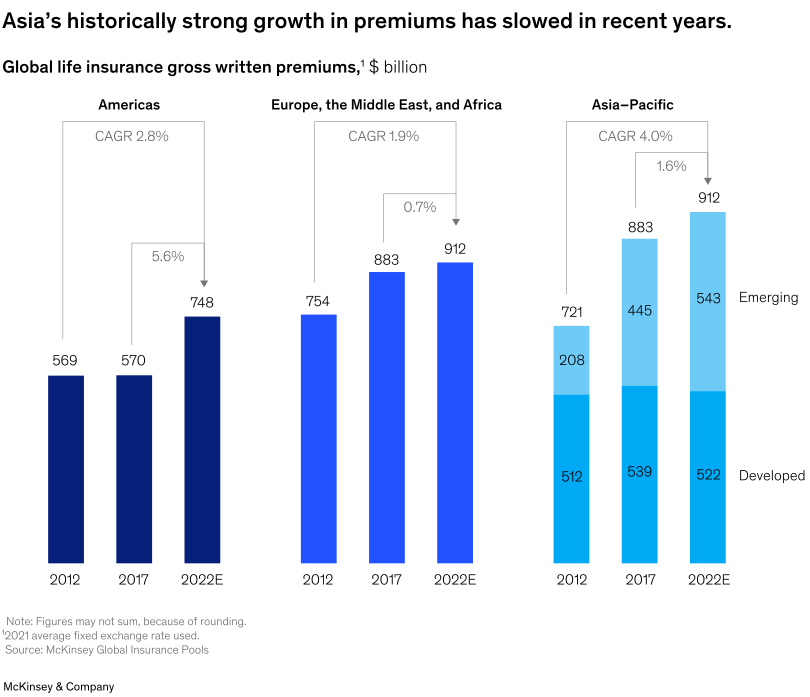
November 21, 2023 – As global insurers increasingly focus on Asia as a growth engine, some pockets of the industry have slowed. Consider life insurance: according to senior partner Bernhard Kotanko and coauthors, life insurance premiums in Asia grew at 4.0 percent overall annually from 2012 to 2022, significantly outpacing the Americas (2.8 percent annual growth) and Europe, the Middle East, and Africa (1.9 percent annual growth). Nonetheless, Asia’s growth slowed to 1.6 percent a year from 2017 to 2022, in part due to the market effects of the COVID-19 pandemic.
To read the report, see “Global Insurance Report 2023: A paradigm shift in Asia life insurance,” November 3, 2023.
customizer here
Visual form
Three-panel bar chart with one stacked bar series. The chart compares regional premium levels across time and uses the Asia-Pacific panel to split totals into developed and emerging components.
Layout / body structure
The chart is arranged left to right by region: Americas, Europe Middle East and Africa, and Asia-Pacific. Each region shows bars for 2012, 2017, and 2022E, and the Asia-Pacific panel adds a stacked structure so the reader can see the developed-versus-emerging composition inside the regional total.
What is being compared
The visual compares life-insurance gross written premiums across the three major regional groupings and across three time points. It also compares the internal mix of Asia-Pacific premiums between developed and emerging markets, which is the only panel with a split composition.
Measurement system
The values are measured in billions of dollars, and the chart also annotates compound annual growth rates above the regional panels. The reader tracks the printed bar labels for level and the CAGR callouts for rate of change over the full period and the later subperiod.
Visible structure inside the graphic
The Americas and EMEA panels use straightforward vertical bars, while Asia-Pacific uses stacked bars with a darker developed segment and a lighter emerging segment. Growth-rate brackets above the panels help the reader connect the bar heights to the slowdown story rather than reading only absolute level.
Main takeaway from the visual
Asia-Pacific remains the largest growth engine, but its pace has slowed in the later years. The chart makes that visible by showing the highest regional CAGR over the full 2012 to 2022 period in Asia-Pacific while also labeling a much lower 1.6 percent later-period growth rate above that same panel.
Key standout values or extremes
Asia-Pacific rises from 721 billion dollars in 2012 to 912 billion in 2022E and is split into 522 billion developed and 543 billion emerging in the later stacked view. The Americas rise from 569 to 748, EMEA rises from 754 to 912, and the regional CAGR labels show 4.0 percent for Asia-Pacific versus 2.8 percent for the Americas and 1.9 percent for EMEA.
Controls / sequence, when applicable
This is a static chart image with no in-chart controls to operate.
Companion media, when applicable
There is no separate companion audio or video; the chart image is the full visual on this page.