Source page: McKinsey & Company
Commentary
Tech trends worth your time
Digital | Technology
August 21, 2023 – All this week, our daily charts will focus on one of the hottest topics in business: AI. We’ll take a closer look at the technology’s implications for growth, industries, the workforce, and more.
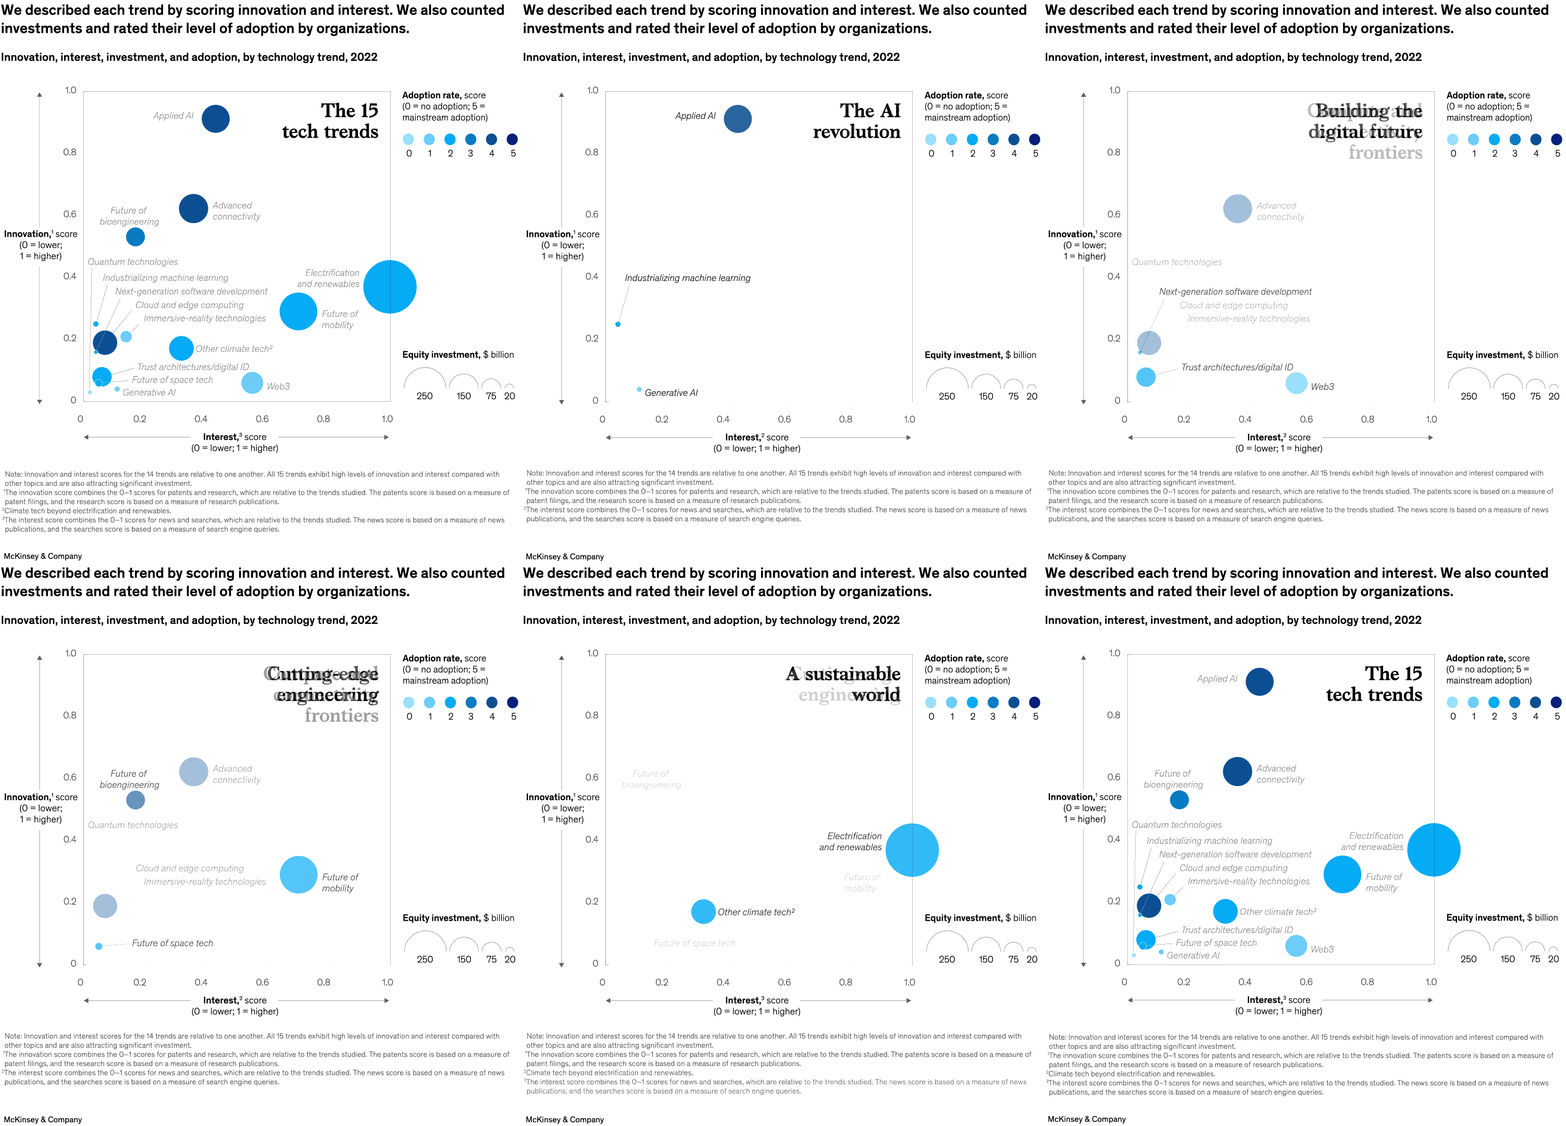
There are 15 tech trends that executives should follow closely, according to a recent report by McKinsey Global Institute partner Michael Chui, senior partner Lareina Yee, and colleagues. Generative AI is garnering lots of attention, for good reason: the technology is poised to add as much as $4.4 trillion annually in economic value. However, firms should not underestimate the growth potential of applied AI and industrializing machine learning, two related trends that have seen a significant uptick in interest, innovation, and investment. For more on all 15 trends, see the animated chart below.
To read the report, see “McKinsey Technology Trends Outlook 2023,” July 20, 2023.
customizer here
Visual form
Bubble scatter plot.
Layout / body structure
The page uses a single scatter field read across interest on the x-axis and up innovation on the y-axis, with bubble size and bubble color adding investment and adoption layers on top.
What is being compared
It compares fifteen technology trends against one another by innovation, interest, investment, and organizational adoption.
Measurement system
The x-axis scores interest, the y-axis scores innovation, bubble area represents equity investment in billions of dollars, and the blue color ramp marks adoption on a 0-to-5 scale.
Visible structure inside the graphic
Named trend bubbles are distributed across the field, a color legend explains adoption, an investment-size legend sits at the lower right, and the labeled bubbles let the reader see which trends cluster together.
Main takeaway from the visual
AI-related trends occupy the most prominent part of the plot, showing that the market is concentrating high interest, strong innovation, and large capital commitments around a small group of fast-moving themes.
Key standout values or extremes
The investment key runs from roughly $20 billion to $250 billion, and the largest visible bubbles sit with the most watched trends rather than with the low-adoption edge of the chart.
Controls / sequence, when applicable
This is a static chart image with no in-chart controls to operate.
Companion media, when applicable
There is no separate companion audio or video; the chart image is the full visual on this page.