Source page: McKinsey & Company
Commentary
Tech's future is bright
Artificial Intelligence | Renewable energy | Technology
September 9, 2024 – All this week, our daily charts will focus on technology trends that matter most across industries in 2024. We’ll explore tech and AI advancements, investments, talent demands, and more.
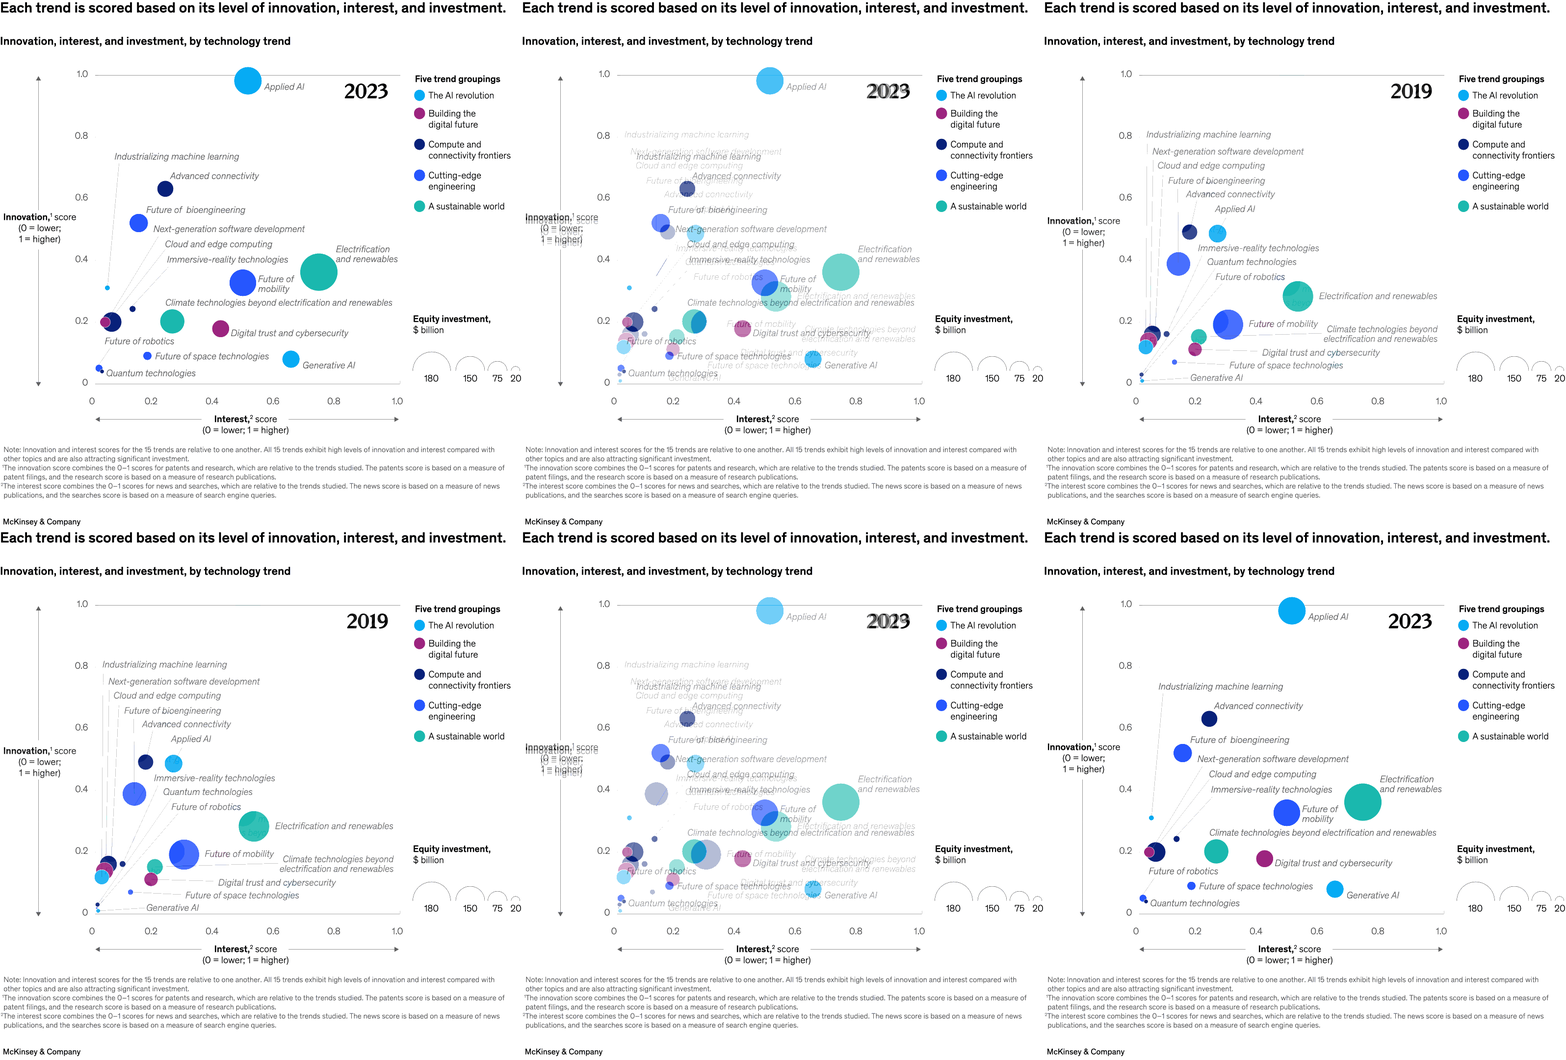
Despite macroeconomic headwinds, the long-term trajectory for the 15 technology trends McKinsey analyzed is positive, say senior partner and chair of McKinsey’s Technology Council Lareina Yee and colleagues. The 15 trends were grouped into five categories: the AI revolution, building the digital future, compute and connectivity frontiers, cutting-edge engineering, and a sustainable world. For each trend, investment was tracked and scores were created for innovation (patents and research) and interest (news and web searches). Generative AI saw a 700 percent uptick in Google searches and a substantial investment increase from 2022 to 2023. Additionally, electrification and renewables posted the highest investment and interest scores.
To read the report, see “McKinsey Technology Trends Outlook 2024,” July 16, 2024.
customizer here
Visual form
Bubble scatter plot.
Layout / body structure
The chart is a single scatter plot with innovation on the vertical axis and interest on the horizontal axis, a color legend on the right for five trend groupings, and a bubble-size key below that for equity investment.
What is being compared
It compares technology trends against one another on two scored dimensions – innovation and interest – while also encoding the size of equity investment and the trend family each point belongs to.
Measurement system
Both axes run from 0 to 1, bubble area represents equity investment in billions of dollars, and color separates the five groupings: the AI revolution, building the digital future, compute and connectivity frontiers, cutting-edge engineering, and a sustainable world.
Visible structure inside the graphic
Each trend appears as a labeled circle positioned by its innovation and interest scores, with large bubbles pulling attention to the most heavily funded trends and the right-side legends explaining both color group and investment scale.
Main takeaway from the visual
The chart shows that the biggest technology trends do not sit in one single corner: applied AI stands almost alone at the top of the innovation scale, electrification and renewables and generative AI pull furthest to the right on interest, and several lower-interest trends cluster closer to the bottom-left.
Key standout values or extremes
Applied AI sits near an innovation score of 1.0 with one of the largest bubbles on the chart, electrification and renewables sits far to the right at roughly three-quarters of the interest scale, generative AI also sits well to the right but much lower on innovation, and quantum technologies stays near the bottom-left with very low scores on both axes.
Controls / sequence, when applicable
This is a static chart image with no in-chart controls to operate.
Companion media, when applicable
There is no separate companion audio or video; the chart image is the full visual on this page.