Source page: McKinsey & Company
Commentary
The aerospace inventory drag
Aerospace | Supply Chain Management
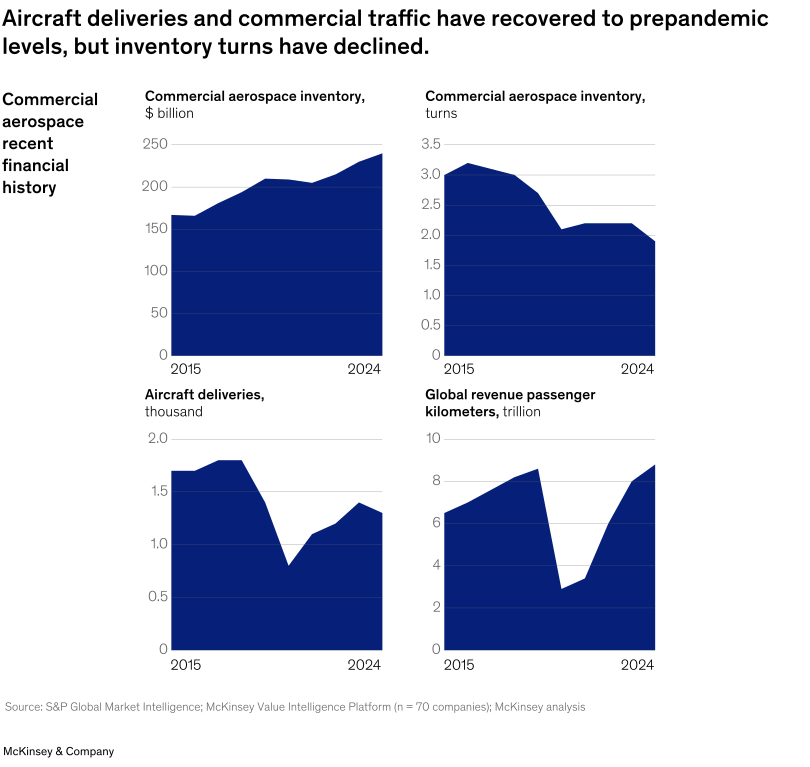
February 4, 2026 – While commercial air traffic and aircraft deliveries have recovered to prepandemic levels, the aerospace supply chain is experiencing inefficiencies. Partner Michelle Bryant and coauthors note that commercial aerospace inventory has reached $240 billion, but inventory turns—which measures how many times a business has sold and replaced its total inventory during a given period—reached a ten-year low, declining from 3.0 in 2015 to 1.9 in 2024. Companies that can effectively address inventory inefficiencies could strengthen supplier relationships and position their organizations for sustainable growth.
To read the article, see “Fly high, stock higher: Managing A&D inventory to save $60 billion,” November 19, 2025.
customizer here
Visual form
Line Chart: three-panel aerospace recovery and inventory-efficiency comparison from 2005 to 2024.
Layout / body structure
The chart uses three aligned line charts for passenger traffic, aircraft deliveries, and inventory turns. The first two panels show demand and delivery recovery, while the third panel shows inventory efficiency moving in the opposite direction.
What is being compared
It compares commercial air traffic, aircraft deliveries, and commercial aerospace inventory turns over time to show whether operational efficiency recovered along with demand.
Measurement system
Passenger traffic is measured in trillions of revenue passenger kilometers, aircraft deliveries are measured in units, and inventory turns measure how many times inventory is sold and replaced in a year.
Visible structure inside the graphic
Passenger traffic and aircraft deliveries rise back toward or above prepandemic levels by 2024, while the inventory-turns line trends downward after 2015. The contrast makes the supply-chain drag visible despite demand recovery.
Main takeaway from the visual
The chart shows that aerospace demand and deliveries have recovered, but inventory productivity has worsened. The sector is carrying more stock while turning it more slowly.
Key standout values or extremes
Passenger traffic rises from about 3.1 trillion revenue passenger kilometers in 2005 to 9.4 trillion in 2024, and aircraft deliveries rise from about 800 to 1,300 units. Inventory turns fall from 3.0 in 2015 to 1.9 in 2024, while commercial aerospace inventory has reached about $240 billion.
Controls / sequence, when applicable
This is a static three-panel line chart; there are no in-chart controls to operate.
Companion media, when applicable
There is no separate companion audio or video; the aerospace traffic, deliveries, and inventory-turns line chart is the full visual on this page.