Source page: McKinsey & Company
Commentary
The business case for diverse leadership
Leadership | Growth | Diversity & Inclusion
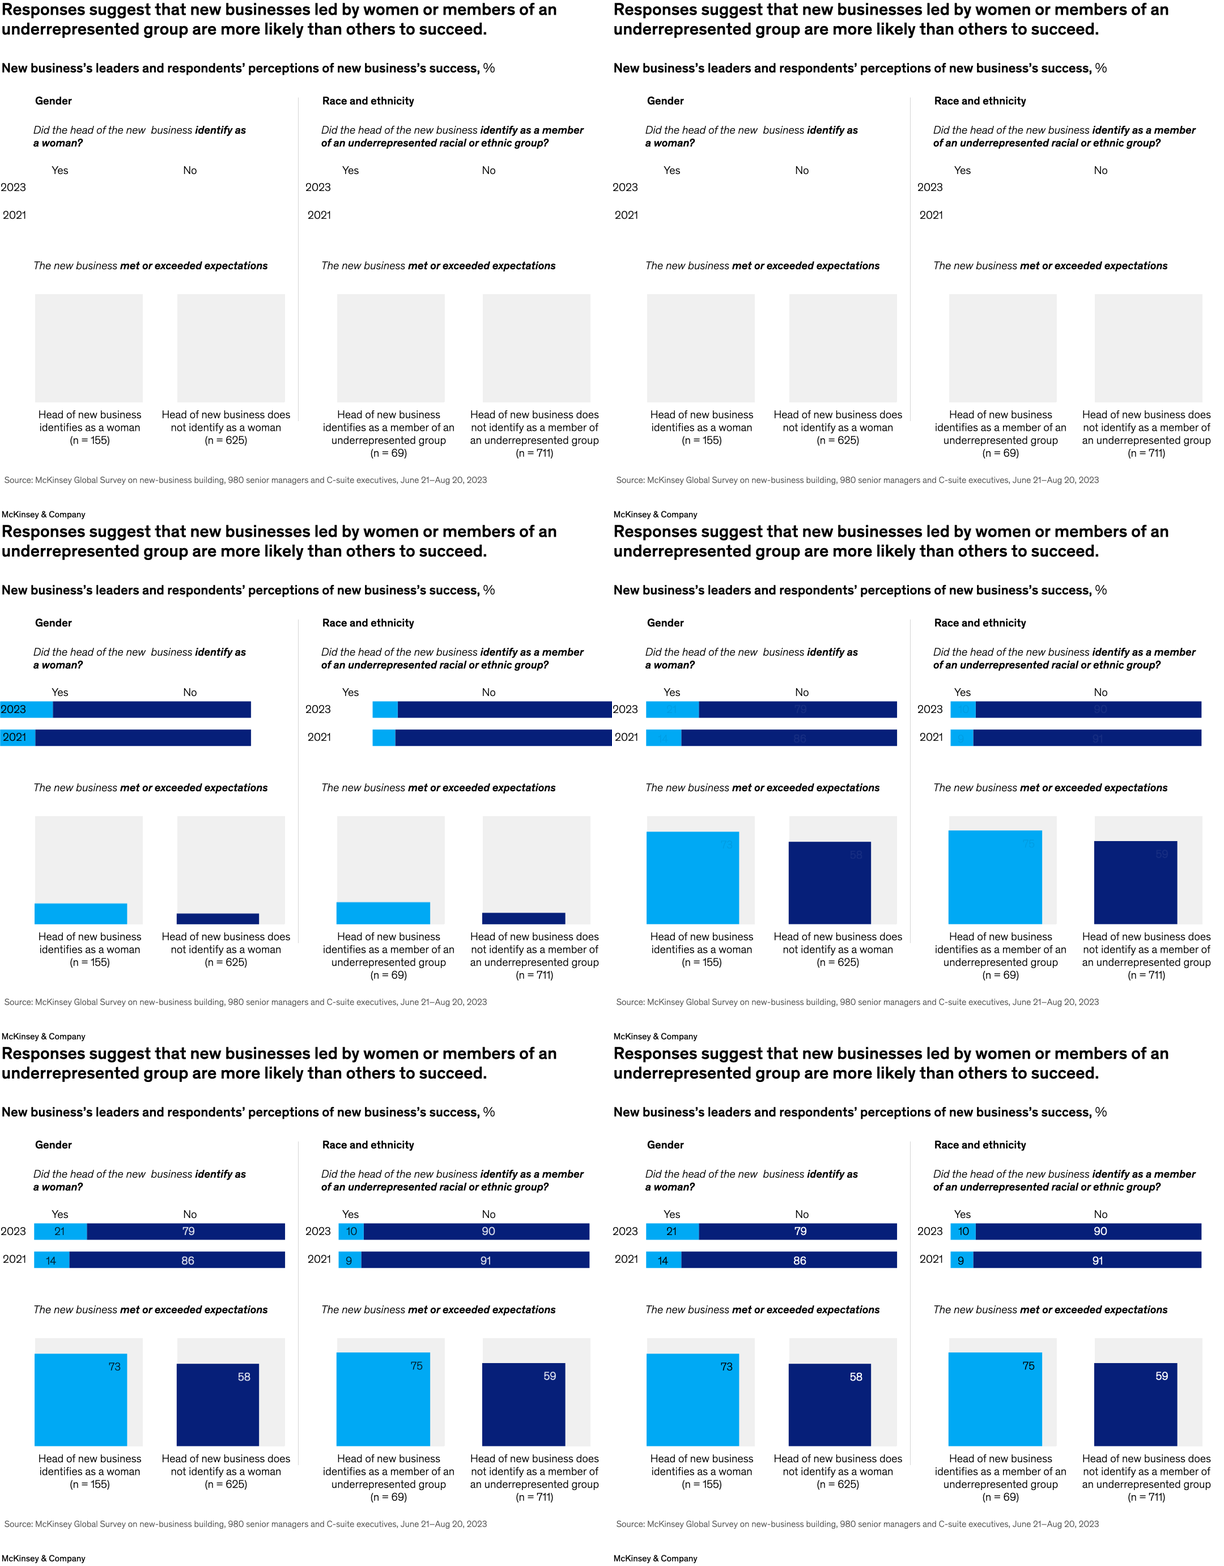
November 20, 2023 – One key way to build new businesses could be tapping underrepresented talent for leadership. According to a survey by senior partner Ari Libarikian and colleagues, new businesses led by individuals who identify as women, members of underrepresented racial or ethnic groups, or both are much more likely than other leaders to report that the businesses have met or exceeded organizations’ expectations.
To read the survey, see “CEOs’ choice for growth: Building new businesses,” November 9, 2023.
customizer here
Visual form
Paired bar-and-composition display. The upper section uses split horizontal bars to show leader identity shares across years, and the lower section uses vertical bars to compare success outcomes for those leadership groups.
Layout / body structure
The page is divided into two side-by-side topics: gender on the left and race and ethnicity on the right. Within each topic, the reader first sees the 2021 and 2023 composition bars and then reads the lower pair of success bars showing whether the new business met or exceeded expectations.
What is being compared
The visual compares who leads new businesses and how those businesses are perceived to perform. It contrasts women-led versus other-led businesses and underrepresented-group-led versus other-led businesses, while also comparing 2021 and 2023 representation shares in the upper half.
Measurement system
All values are percentages. The upper bars sum to 100 percent and show the share of new-business heads in each identity category by year, while the lower bars show the share of businesses that met or exceeded expectations for the leadership groups being compared.
Visible structure inside the graphic
Each half of the page has a two-row structure: stacked horizontal bars above and stand-alone comparison bars below. The same blue highlight color is used for the underrepresented group in each half, which makes it easy to connect the representation comparison with the later success comparison.
Main takeaway from the visual
The groups with lower representation in leadership are shown as having stronger success rates. The lower bars make that especially clear because the bars for women-led businesses and for underrepresented-group-led businesses are visibly taller than the comparison bars beside them.
Key standout values or extremes
In the gender section, the share of new-business heads who identify as women rises from 14 percent in 2021 to 21 percent in 2023, and the success bars show 73 percent versus 58 percent for businesses meeting or exceeding expectations. In the race-and-ethnicity section, the leadership share moves from 9 percent to 10 percent, while the success bars show 75 percent versus 59 percent.
Controls / sequence, when applicable
This is a static chart image with no in-chart controls to operate.
Companion media, when applicable
There is no separate companion audio or video; the chart image is the full visual on this page.