Source page: McKinsey & Company
Commentary
The cost of climate adaptation
Sustainability | Climate change
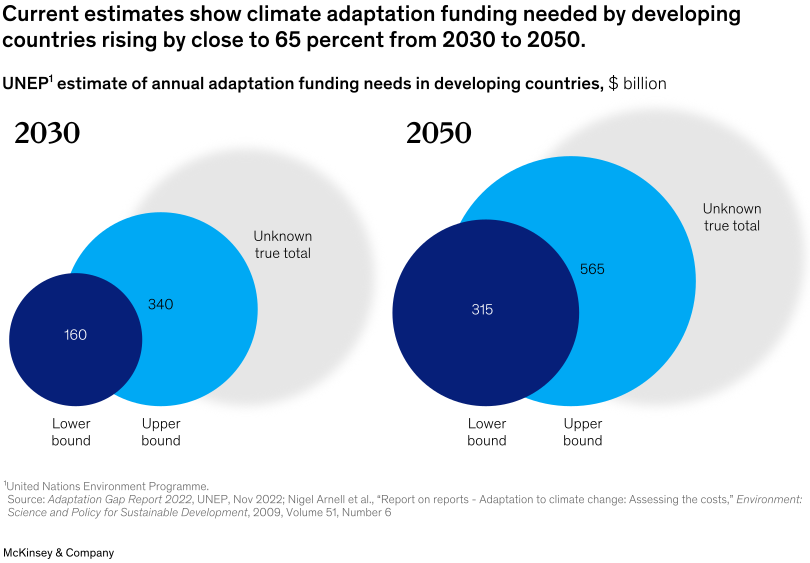
November 27, 2023 – The poorest and least-developed nations are likely to face the most devastating effects from climate change. They also have the least capacity to adapt to the changing conditions, find managing partner for global client capabilities Homayoun Hatami, senior partner Hamid Samandari, and colleagues. Successful adaption would require massive financial transfers from developed countries. One estimate suggests that the annual costs for developing countries could range from $160 billion to $340 billion by 2030, and $315 billion to $565 billion by 2050.
To read the article, see “Ten key requirements for a systematic approach to climate adaptation,” November 8, 2023.
customizer here
Visual form
Paired bubble comparison. The visual uses overlapping circles to show lower-bound, upper-bound, and unknown-true-total estimates for annual adaptation funding needs in two different future years.
Layout / body structure
The chart is arranged as two side-by-side panels for 2030 and 2050. Each panel contains a dark lower-bound circle, a brighter upper-bound circle, and a large faded background circle representing the unknown true total, so the reader can compare the estimate ranges between the two years at a glance.
What is being compared
The visual compares annual climate-adaptation funding needs for developing countries at two points in time. It is comparing the lower and upper estimate bounds in 2030 versus 2050 and using the background circle to signal that the true need could extend beyond the reported range.
Measurement system
The unit is billions of dollars per year. Circle labels provide the exact lower-bound and upper-bound estimates, and the relative circle sizes reinforce how much larger the funding requirement becomes by 2050.
Visible structure inside the graphic
Each panel contains a pair of overlapping labeled circles in blue tones plus a larger gray shadow circle behind them. The repetition of the same three-circle structure for 2030 and 2050 makes the increase in scale immediately visible without needing a traditional axis.
Main takeaway from the visual
Climate-adaptation funding needs in developing countries rise sharply over time and remain uncertain even within the published estimate range. The side-by-side bubble panels make that visible by scaling both the lower and upper bounds noticeably higher in 2050 than in 2030.
Key standout values or extremes
For 2030 the lower bound is labeled 160 billion dollars and the upper bound 340 billion dollars. For 2050 those figures rise to 315 billion and 565 billion dollars, which is the basis for the headline statement that funding needed rises by close to 65 percent from 2030 to 2050.
Controls / sequence, when applicable
This is a static chart image with no in-chart controls to operate.
Companion media, when applicable
There is no separate companion audio or video; the chart image is the full visual on this page.