Source page: McKinsey & Company
Commentary
The cost of dining out
Marketing & Sales | Food
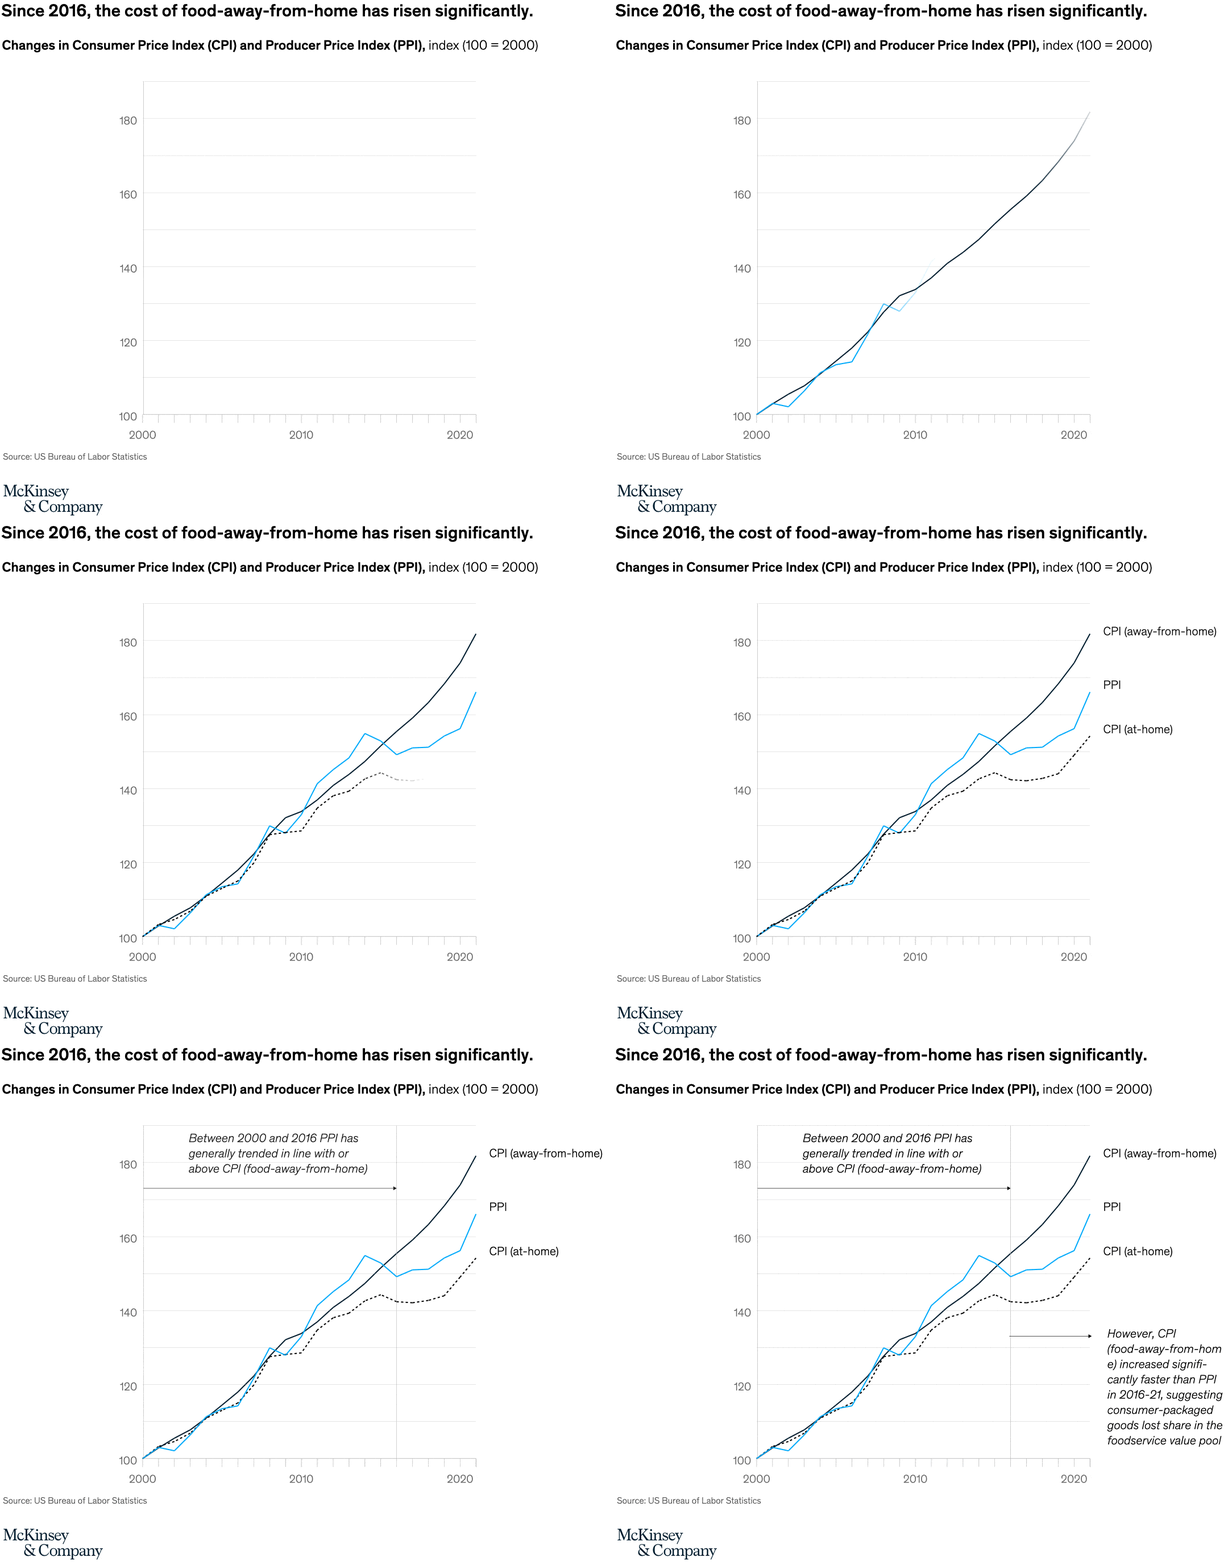
April 29, 2022 – Whether you’re eating in or dining out, food prices are on the rise. But compared with the cost of groceries, the cost of food-away-from-home (which includes meals at restaurants, catered events, and other venues) has increased significantly. The current round of prolonged inflation has caused prices for finished food products and consumer prices to rise at an unprecedented rate.
To read the article, see “Revenue growth management: Unlocking value in foodservice,” March 29, 2022.
customizer here
Visual form
Three-series line chart.
Layout / body structure
The chart is a single time-series panel running from 2000 on the left to 2020 on the right. Read left to right across the shared plot, using the three lines and the callout annotations to compare how restaurant prices, producer prices, and grocery prices separate over time.
What is being compared
The chart compares CPI for food away from home, PPI, and CPI for food at home over a little more than two decades. It is simultaneously a time comparison and a price-series comparison across restaurant prices, producer prices, and at-home food prices.
Measurement system
All three lines use an index where 100 equals the year 2000 baseline. The reader tracks relative price growth rather than dollar amounts, with the dark line for CPI away from home, the blue line for PPI, and the dashed line for CPI at home sharing one vertical scale.
Visible structure inside the graphic
The chart places all three lines on the same axes so their crossings and separations are easy to see. One annotation spans the 2000 to 2016 period to show that PPI generally stayed in line with or above food-away-from-home CPI, while a second note on the right highlights the widening post-2016 gap.
Main takeaway from the visual
Restaurant prices begin to outpace both producer prices and at-home food prices after 2016. The away-from-home CPI line pulls steadily higher into 2020, while PPI and at-home CPI remain visibly lower, which makes the later divergence the defining feature of the chart.
Key standout values or extremes
By the right edge of the chart, CPI for food away from home is a little above 180, PPI is in the mid-160s, and CPI for food at home is in the mid-150s. Earlier in the chart the three series travel much closer together, which makes the late widening of the away-from-home line the clearest numerical spread on the page.
Controls / sequence, when applicable
This is a static chart image with no in-chart controls to operate.
Companion media, when applicable
There is no separate companion audio or video; the chart image is the full visual on this page.