Source page: McKinsey & Company
Commentary
The ephemeral effect of stock index inclusion
Strategy | Investing
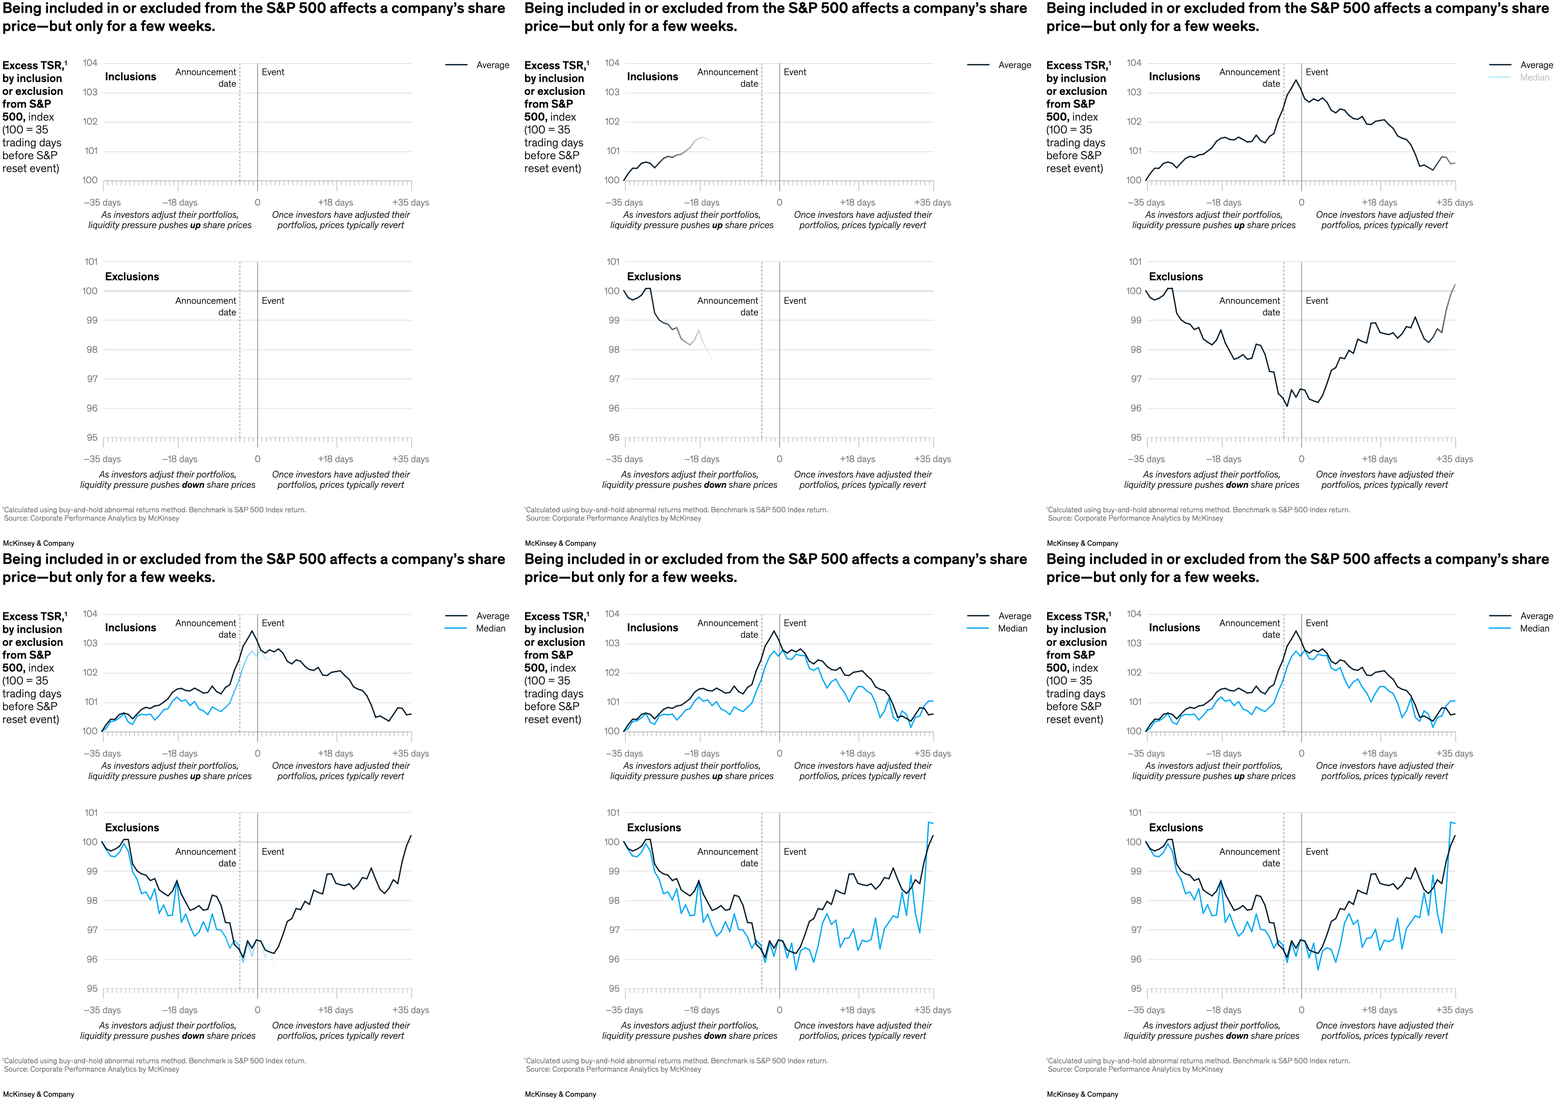
June 27, 2024 – Inclusion in or exclusion from a major stock index can affect a company’s share price, but the effects are temporary. Partner Tim Koller and coauthors analyzed hundreds of companies that were added to or removed from the S&P 500 over the history of the index and found that a company’s stock price returns to its intrinsic value within two months of the inclusion or removal. Shareholder returns drive index inclusion or exclusion, not the other way around, they say.
To read the article, see “The myth of an enduring index premium,” May 31, 2024.
customizer here
Visual form
Line chart.
Layout / body structure
This is a two-panel event-study layout, with inclusions on the top panel and exclusions on the bottom panel. Read each panel left to right across the event window and compare the average and median traces within the same panel before comparing top versus bottom.
What is being compared
It compares share-price behavior around S&P 500 reset events for companies entering the index versus companies leaving it.
Measurement system
The measure is indexed excess total shareholder return, with 100 set to 35 trading days before the event. The x-axis runs from 35 days before to 35 days after, and the two line colors separate average from median performance.
Visible structure inside the graphic
Each panel has two lines, a dashed vertical marker for announcement date, and a solid vertical marker for event day. The top panel rises into the event for inclusions, while the bottom panel falls into the event for exclusions and then both panels move back toward the baseline afterward.
Main takeaway from the visual
The chart shows that index changes move share prices only temporarily: additions get a short lift, deletions get a short drop, and both effects fade after investors have adjusted their portfolios.
Key standout values or extremes
Inclusions peak a little above 103 before settling back toward 100, while exclusions trough around 96 and then recover toward the baseline by the end of the window.
Controls / sequence, when applicable
This is a static chart image with no in-chart controls to operate.
Companion media, when applicable
There is no separate companion audio or video; the chart image is the full visual on this page.