Source page: McKinsey & Company
Commentary
The future of work in America
Artificial Intelligence | Jobs | North America
August 24, 2023 – All this week, our daily charts will focus on one of the hottest topics in business: AI. We’ll take a closer look at the technology’s implications for growth, industries, the workforce, and more.
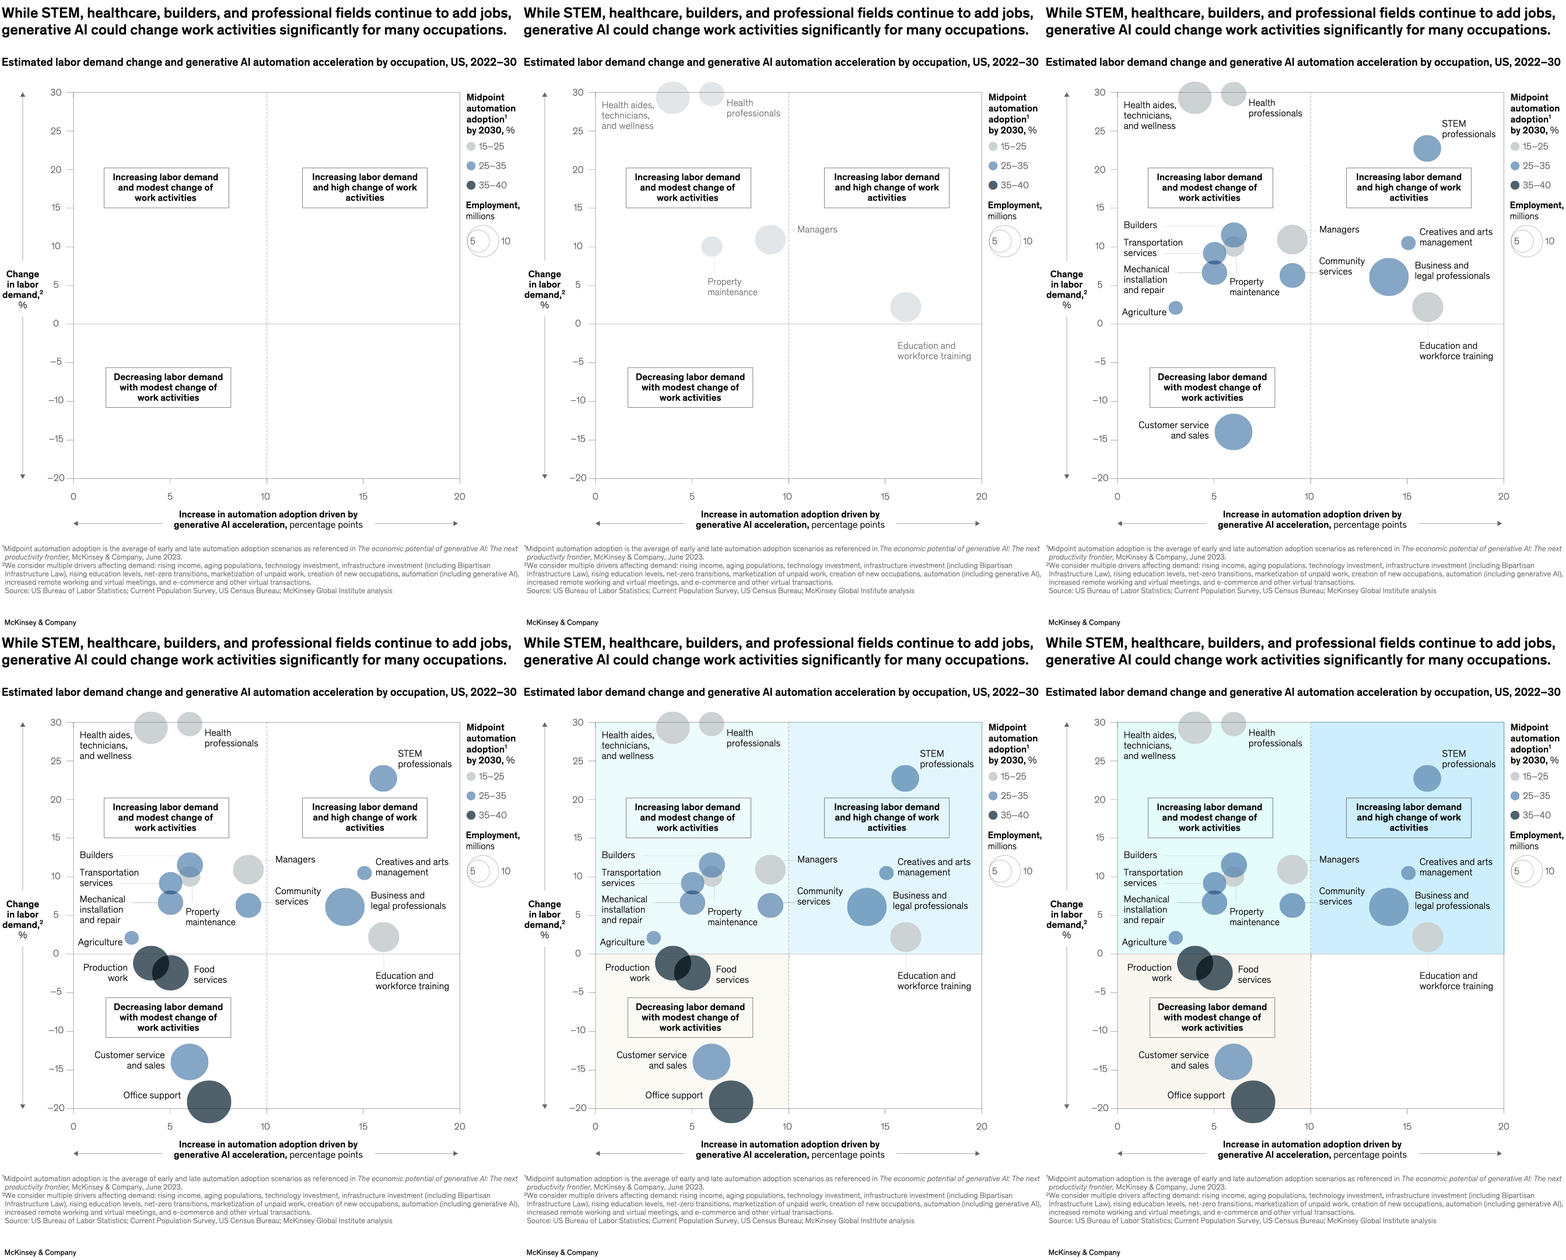
The US labor market has gone through a rapid transition—which should only continue, when factoring in the impact of AI. Going forward, healthcare and STEM fields could see significant job gains by 2030, according to Kweilin Ellingrud, a McKinsey Global Institute director, and coauthors. Occupational categories facing the biggest potential job losses include office support, customer service, and food services. We estimate that demand for clerks could decrease by 1.6 million jobs.
To read the report, see “Generative AI and the future of work in America,” July 26, 2023.
customizer here
Visual form
Bubble scatter plot.
Layout / body structure
It is a single quadrant chart read first by position in the four-part field and then by bubble size, with quadrant callouts inside the plot and a bubble-size key at the right.
What is being compared
It compares occupation groups by estimated change in labor demand on the vertical axis and generative-AI-driven acceleration of automation adoption on the horizontal axis.
Measurement system
The vertical scale tracks percent change in labor demand, the horizontal scale tracks percentage-point change in automation adoption, and bubble size represents employment in millions.
Visible structure inside the graphic
The plot uses quadrant labels, bubble markers, axis titles, and a size legend, so the reader can separate growing-demand occupations from shrinking-demand occupations while also seeing how large each employment pool is.
Main takeaway from the visual
The chart shows that job growth and higher automation exposure can coexist in some fields, while other occupations sit in the declining-demand half of the plot and face a more difficult transition.
Key standout values or extremes
The visible field stretches from negative labor-demand territory to growth above 20 percent, and the size key highlights that the redistribution is happening across employment pools measured in the millions.
Controls / sequence, when applicable
This is a static chart image with no in-chart controls to operate.
Companion media, when applicable
There is no separate companion audio or video; the chart image is the full visual on this page.