Source page: McKinsey & Company
Commentary
The golden decade for GCC banks
Banking | Fintech | Oil & Gas
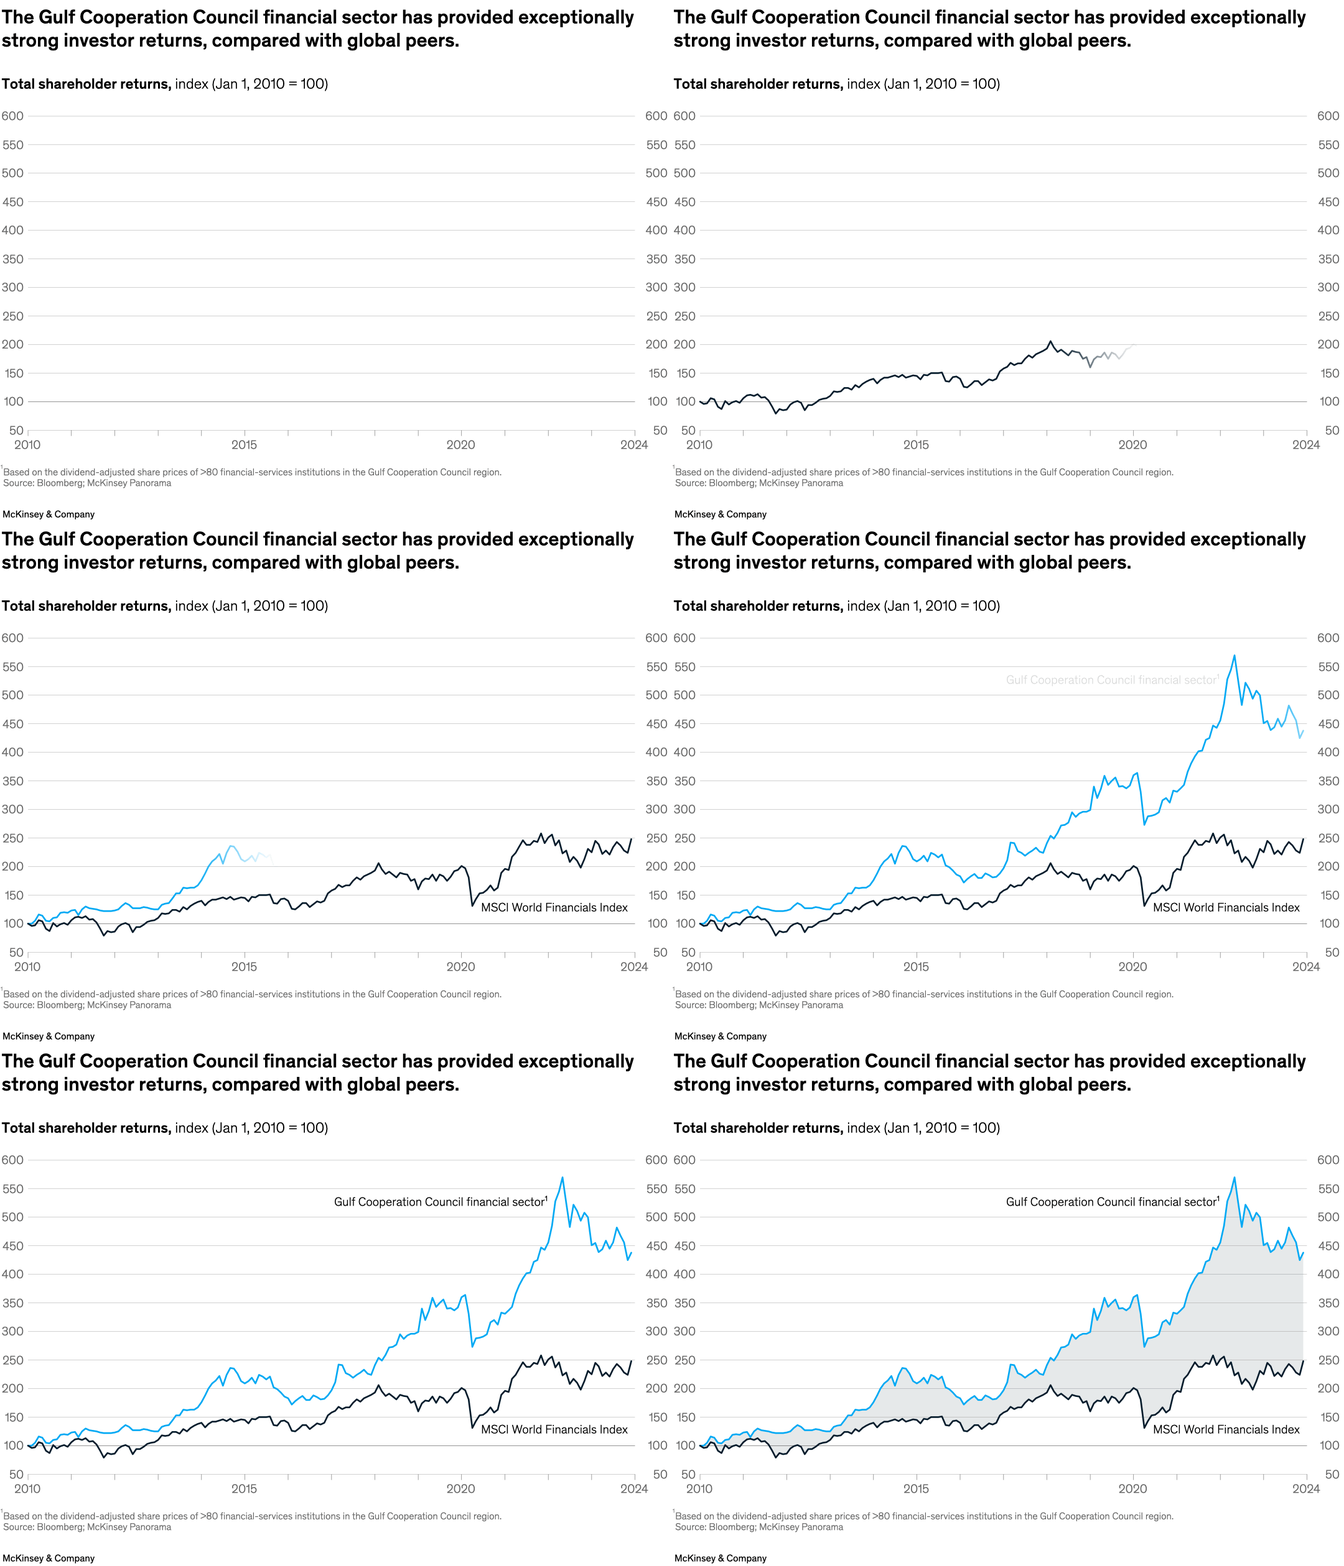
August 8, 2024 – The Gulf Cooperation Council (GCC) banking group has delivered exceptional returns to shareholders over the past decade. Senior partner Alberto Alvarez and colleague find that the TSR of GCC banks has outpaced the MSCI World Financials Index since 2010. Several factors have spurred the group’s performance, including high hydrocarbon prices, rapid growth, low unemployment rates, favorable demographics, ambitious public investment programs, and moderate inflation.
To read the report, see “The state of GCC banking: An exceptional operating environment,” June 26, 2024.
customizer here
Visual form
Two-series indexed line chart.
Layout / body structure
The chart is a single wide time-series chart read left to right from 2010 to 2024, with the Gulf Cooperation Council line highlighted in blue and lightly shaded beneath, and the global peer index drawn as a darker comparison line below it for most of the period.
What is being compared
It compares total shareholder returns for the Gulf Cooperation Council financial sector against the MSCI World Financials Index over the same long run.
Measurement system
Both series are indexed to January 1, 2010 = 100, so the chart is showing relative growth in shareholder returns rather than raw currency values.
Visible structure inside the graphic
The blue GCC line rises in large waves with pronounced peaks and pullbacks, the darker world-financials line follows a much lower path, and the labels are printed directly near the lines instead of relying on a separate legend.
Main takeaway from the visual
The Gulf Cooperation Council financial sector clearly outperforms global financial peers across the decade, with the gap between the two lines widening dramatically after the mid-2010s and staying large through the end of the period.
Key standout values or extremes
The GCC line starts near 100, surges above 500 at its peak, and still ends around the mid-400s, while the MSCI World Financials Index peaks only around the mid-200s and finishes near the low- to mid-200s.
Controls / sequence, when applicable
This is a static chart image with no in-chart controls to operate.
Companion media, when applicable
There is no separate companion audio or video; the chart image is the full visual on this page.