Source page: McKinsey & Company
Commentary
The growing education gap
Education | COVID-19
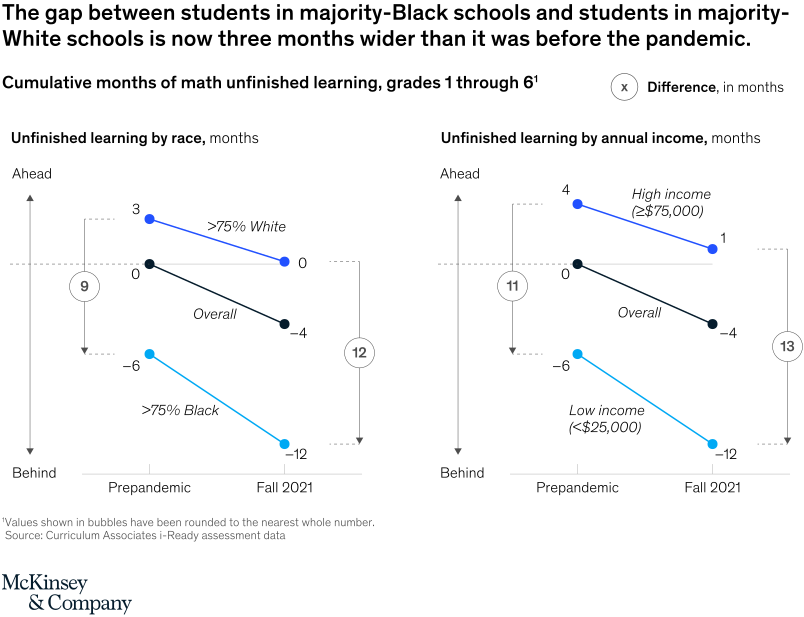
March 8, 2022 – Education inequities that existed prepandemic were exacerbated as a result of the COVID-19 crisis. Students in majority-Black schools were about nine months behind their peers in majority-White schools in math courses before the pandemic. Now the achievement gap is at a year.
To read the article, see “COVID-19 and education: An emerging K-shaped recovery,” December 14, 2021.
customizer here
Visual form
Two-panel bubble comparison chart.
Layout / body structure
The chart is split into two side-by-side panels, one for unfinished learning by race and one for unfinished learning by annual income. Inside each panel the reader compares prepandemic and fall 2021 bubble values, moving left to right within the panel and then across to the next panel.
What is being compared
The chart compares cumulative months of math unfinished learning for students in majority-White and majority-Black schools, and separately for higher-income and lower-income students. It is comparing two demographic gaps at two time points rather than following a long time series.
Measurement system
The measure is cumulative months of unfinished learning in math for grades 1 through 6. The page uses bubble labels with rounded whole-month values, and a vertical framing from ahead to behind to show that larger values mean students are further behind.
Visible structure inside the graphic
Each panel contains paired bubbles for prepandemic and fall 2021, with an explicit difference callout above the panel. The race panel and the income panel use the same visual grammar, which makes the widening-gap comparison easy to read across both demographic views.
Main takeaway from the visual
The chart shows that unfinished learning was already uneven before the pandemic and widened further by fall 2021. The race gap grows from the prepandemic difference to a larger fall 2021 gap, and the income gap also remains large, so the page reads as a widening inequality chart rather than a simple overall setback.
Key standout values or extremes
The race panel highlights a 12-month unfinished-learning level for students in majority-Black schools in fall 2021 versus 9 months for students in majority-White schools, producing a three-month wider gap than before the pandemic. The income panel shows 13 months for low-income students versus 12 months overall and 8 months for high-income students in fall 2021, which keeps the income divide visibly wide as well.
Controls / sequence, when applicable
This is a static chart image with no in-chart controls to operate.
Companion media, when applicable
There is no separate companion audio or video; the chart image is the full visual on this page.