Source page: McKinsey & Company
Commentary
The growth trifecta
Corporate finance | Strategy | Sustainability
September 11, 2023 – Financially successful companies that integrate environmental, social, and corporate governance (ESG) priorities into their growth strategies outperform their peers if they also overachieve on fundamentals, senior partner Lucy Pérez and colleagues find in an analysis of more than 2,200 public companies. Those that outperformed in ESG, profit, and growth produced two percentage points of total shareholder returns above peers that outperformed on financial metrics alone.
To read the article, see “The triple play: Growth, profit, and sustainability,” August 9, 2023.
customizer here
Visual form
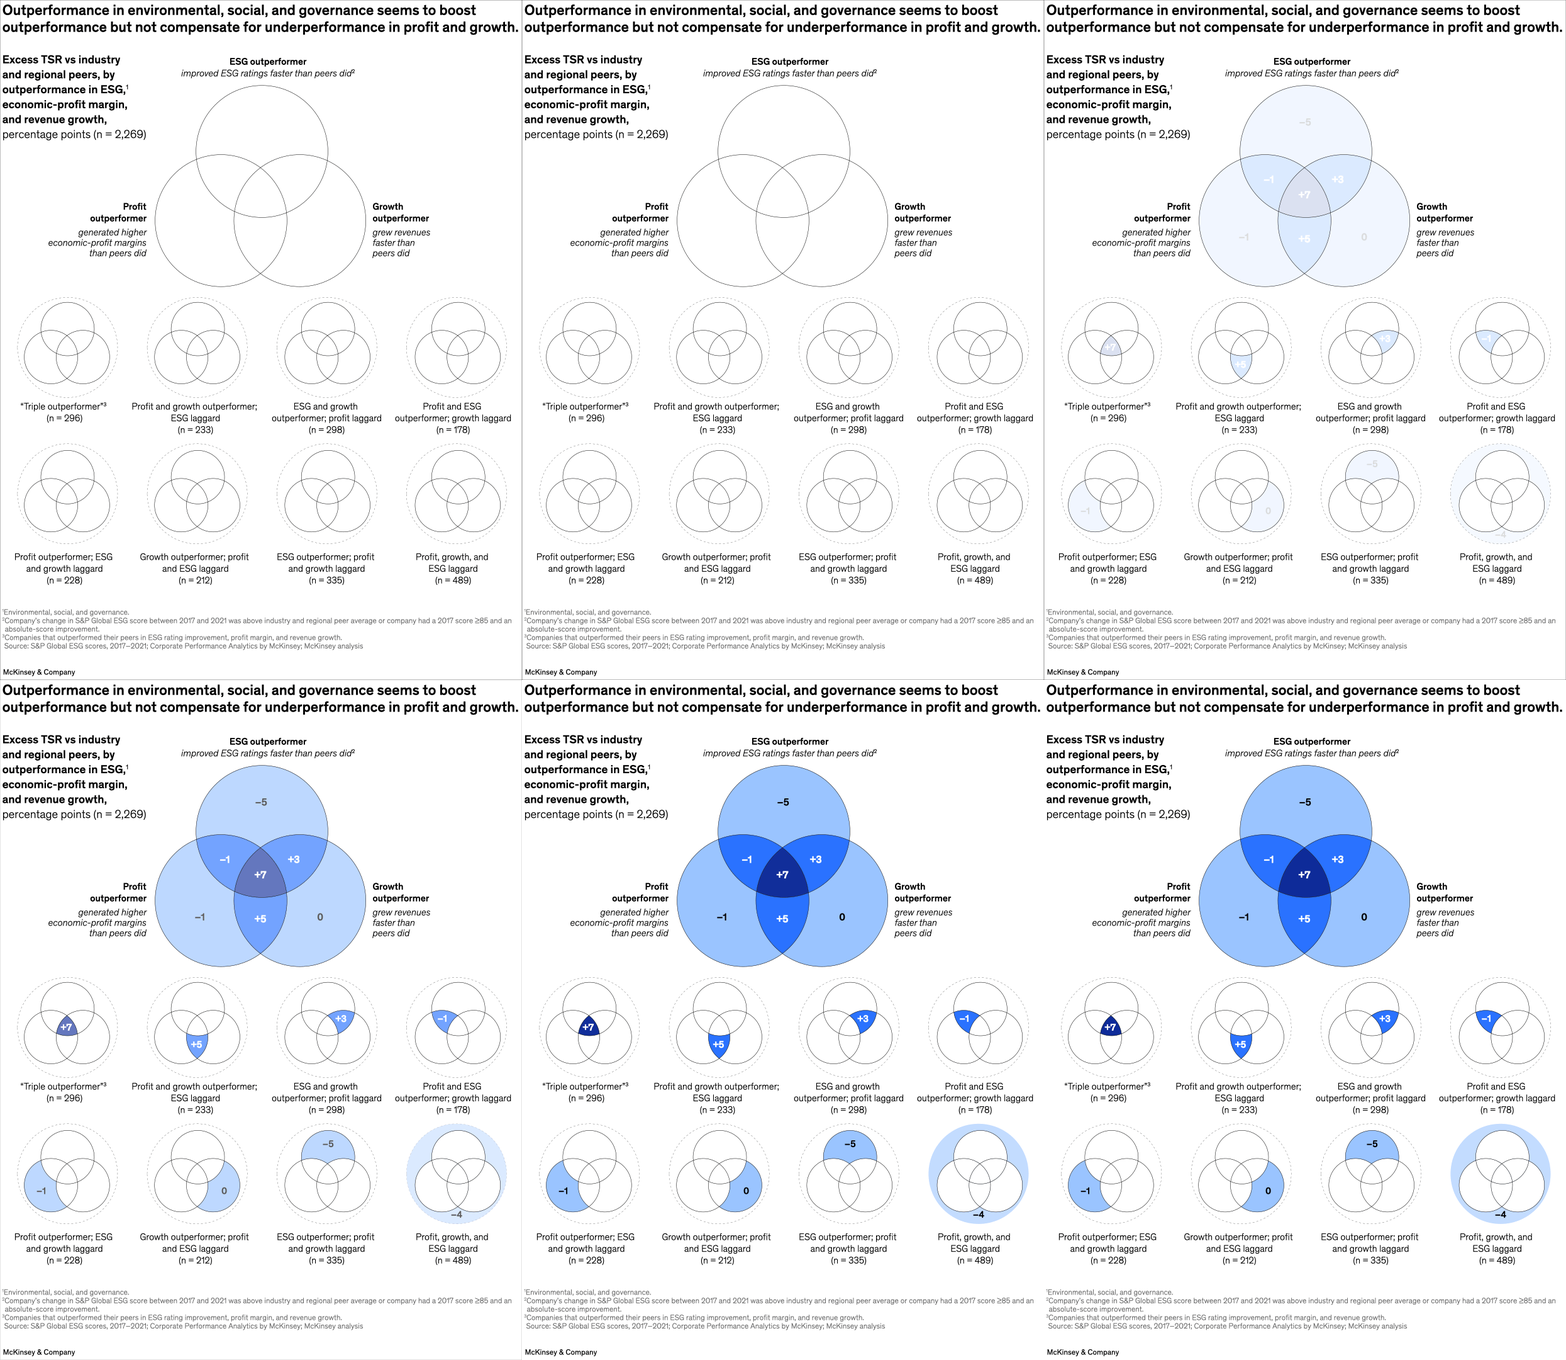
Three-circle Venn diagram with additional category miniatures underneath. It maps companies by whether they outperform on ESG, profit, and growth.
Layout / body structure
The main Venn sits at the top, with ESG, profit, and growth occupying the three overlapping circles, and a second row of smaller Venn diagrams underneath to show each performance combination and sample size. Reader starts with the big overlap and then moves through the category breakdowns below.
What is being compared
It compares company outperformance on three dimensions at once: ESG improvement, economic-profit margin performance, and revenue growth performance.
Measurement system
The unit is excess TSR versus industry and regional peers in percentage points, and the categories are defined by whether a company outperformed on each of the three dimensions. The sample size is also shown for each Venn combination.
Visible structure inside the graphic
The visual uses one large three-way overlap to define the conceptual model and then a series of smaller repeated Venns to break companies into specific buckets such as triple outperformers, profit-and-growth outperformers with ESG lagging, or ESG-and-growth outperformers with profit lagging.
Main takeaway from the visual
ESG strength helps when it accompanies strong profit and growth, but it does not rescue weak financial fundamentals on its own. The three-way overlap makes the best outcome the companies that sit in the shared center rather than in a single-circle ESG-only zone.
Key standout values or extremes
The chart identifies 296 companies as triple outperformers, while larger counts sit in mixed or lagging combinations such as 489 for firms that lag across profit, growth, and ESG. The strongest visual contrast is between the prized three-way overlap and the many companies sitting outside it.
Controls / sequence, when applicable
This is a static chart image with no in-chart controls to operate.
Companion media, when applicable
There is no separate companion audio or video; the chart image is the full visual on this page.