Source page: McKinsey & Company
Commentary
The last recession saw an innovation slowdown in consumer goods
Consumer | Innovation
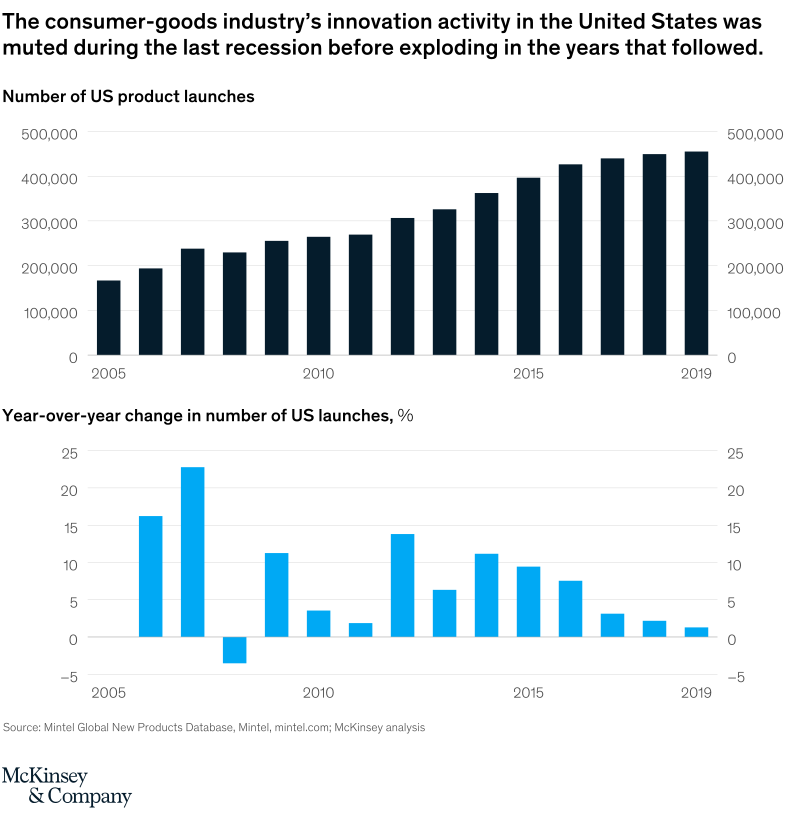
October 22, 2020 – The only year in the past 15 that saw an aggregate decline in new product launches by consumer-goods companies was 2008. But going into the COVID-19 pandemic, the industry kept up the pace of innovation.
To read the article, see “Reimagining consumer-goods innovation for the next normal,” October 16, 2020.
customizer here
Visual form
Bar Chart: annual US consumer-goods product-launch counts with year-over-year change labels.
Layout / body structure
The chart reads left to right from 2005 through 2019. Each year pairs a launch-count bar with an adjacent year-over-year percentage-change label.
What is being compared
It compares annual US consumer-goods product launches before, during, and after the last recession to show how innovation activity changed over time.
Measurement system
The primary measure is total product launches per year. The secondary label is year-over-year percent change.
Visible structure inside the graphic
The annual bars generally rise over the period, with the 2008 bar forming the visible break in the upward pattern. The change label reinforces that dip as the only negative year in the series.
Main takeaway from the visual
The chart shows that the last recession slowed consumer-goods innovation briefly, but did not stop the longer-term rise in product launches.
Key standout values or extremes
Launches rise from 167,000 in 2005 to 455,000 in 2019. The only negative year-over-year change is 2008, when launches fall from 238,000 to 230,000, a 3 percent decline, before rebounding to 255,000 in 2009.
Controls / sequence, when applicable
This is a static time-series bar chart; there are no in-chart controls to operate.
Companion media, when applicable
There is no separate companion audio or video; the consumer-goods launch chart is the full visual on this page.