Source page: McKinsey & Company
Commentary
The medtech marketing future will be digitized
Digital | Healthcare
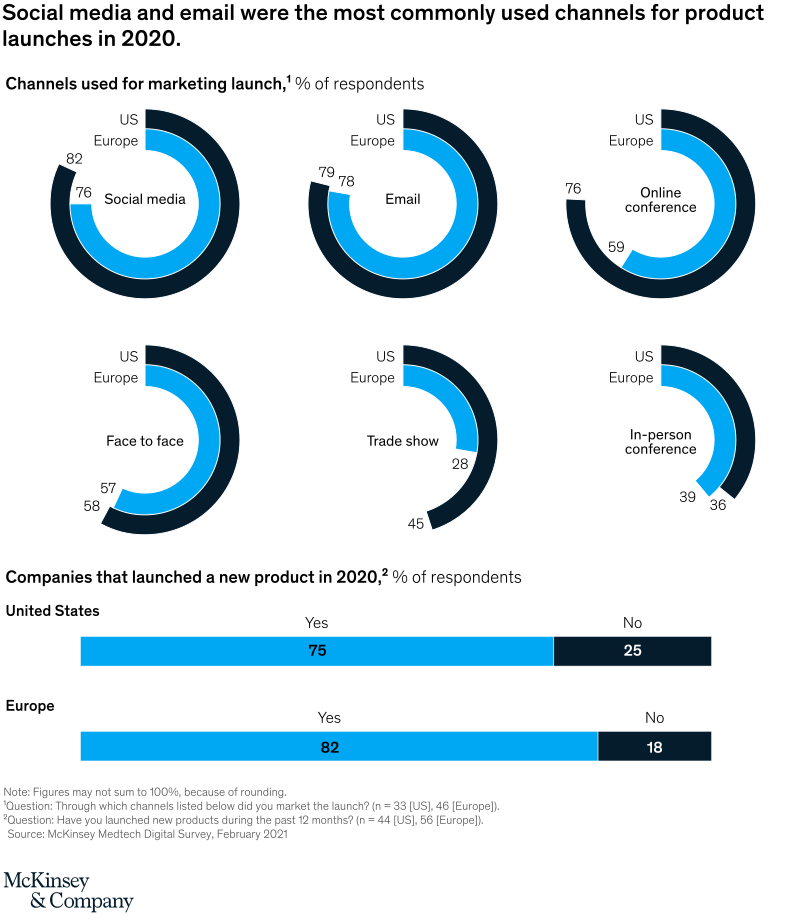
November 12, 2021 – Like many industries, medtech companies shifted to omnichannel strategies as the result of the COVID-19 pandemic. Some marketing methods are more popular than others: while just over half of European medtech businesses launched products via online conferences, more than three-fourths of US companies were willing to go this route.
To read the article, see “The rise of digital marketing in medtechs,” September 24, 2021.
customizer here
Visual form
Donut-chart grid with stacked summary bars.
Layout / body structure
The chart has two layers. The upper layer is a two-by-three grid of donut charts for six launch channels, and the lower layer is a pair of horizontal stacked bars summarizing whether companies launched a new product in 2020 in the United States and Europe.
What is being compared
The chart compares channel use for product launches across the United States and Europe. It also compares the share of companies that launched a new product in 2020 across those two regions.
Measurement system
The donuts are measured as percent of respondents using each launch channel, with dark values for the United States and blue values for Europe. The lower bars are also percentage shares, split into Yes and No responses for whether a company launched a new product in 2020.
Visible structure inside the graphic
Each donut presents a paired US-versus-Europe reading for one channel: social media, email, online conference, face to face, trade show, and in-person conference. Below that, the US and Europe bars are each split into a large Yes segment and a smaller No segment, making the launch incidence easy to compare between regions.
Main takeaway from the visual
Digital channels dominated medtech product launches in 2020, while in-person channels were used less often. The top row makes that visible by placing the highest donut values on social media, email, and online conferences, while the lower channels and the bottom bars show that many companies still launched products, especially in Europe.
Key standout values or extremes
Social media is highest at 82 percent in the United States and 76 percent in Europe, and email follows at 79 and 78 percent. Online conferences also remain high at 76 and 59 percent, while trade shows drop to 45 percent in the United States and 28 percent in Europe; the bottom bars show 75 percent of US respondents and 82 percent of European respondents saying they launched a new product in 2020.
Controls / sequence, when applicable
This is a static chart image with no in-chart controls to operate.
Companion media, when applicable
There is no separate companion audio or video; the chart image is the full visual on this page.