Source page: McKinsey & Company
Commentary
The need for speed?
Consumer | E-commerce
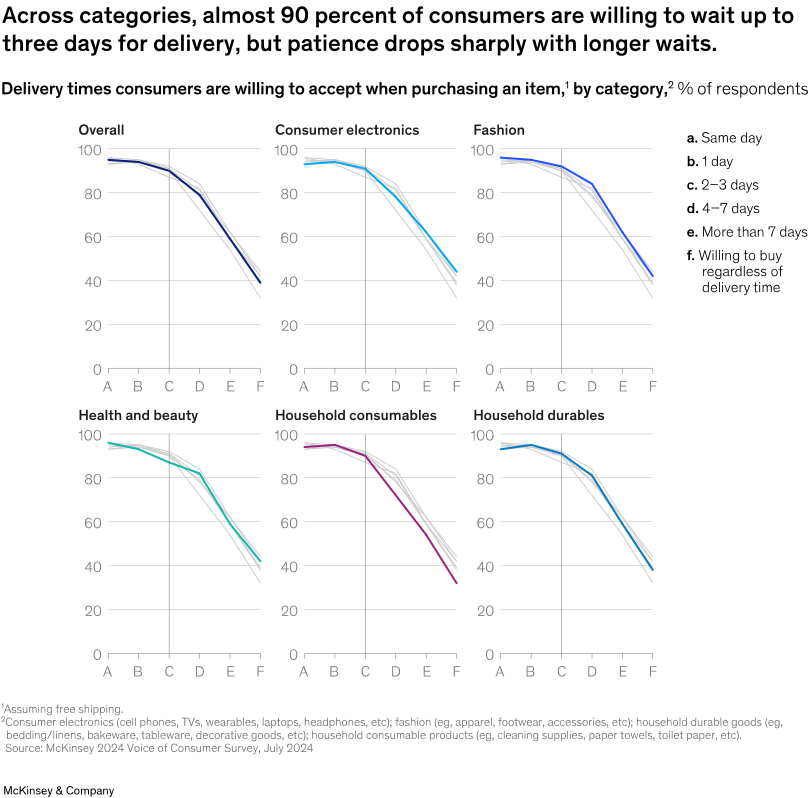
March 18, 2025 – Shoppers continue to enjoy online shopping, but e-commerce growth in the United States is slowing down, and consumer preferences have changed over the past two years. What do today’s online shoppers value most about package deliveries? It was delivery speed back in 2022, but that’s now fallen to fifth place, note Partner Sandy Gosling and coauthors. In fact, a McKinsey survey found that 90 percent of customers are willing to wait at least two to three days for their deliveries if the shipping is free.
To read article, see “What do US consumers want from e-commerce deliveries?,” February 13, 2025.
customizer here
Visual form
Six-panel small-multiple line chart.
Layout / body structure
The chart is laid out as a grid of category panels with a legend on the right. Read each panel left to right across delivery options A through F, then compare the slope and drop-off pattern across the overall panel and the five category panels below and beside it.
What is being compared
It compares the share of consumers willing to accept different delivery times when purchasing an item, both overall and by category. The categories include consumer electronics, fashion, health and beauty, household consumables, and household durables.
Measurement system
Each panel is measured in percent of respondents, with the same vertical scale running from 0 to 100. The horizontal axis uses delivery-time categories from same day through more than seven days and a final option for willingness to buy regardless of delivery time.
Visible structure inside the graphic
Each panel contains a highlighted colored line for the focal category and pale comparison lines in the background. The repeated panel structure makes it easy to see where patience stays high for short waits and where willingness drops sharply as the wait lengthens.
Main takeaway from the visual
The graphic shows that consumers are broadly patient through about three days, but willingness falls quickly once delivery extends beyond that point. The lines in every panel stay high through A to C and then break downward more sharply at the longer-wait categories, with household consumables falling particularly hard by the far-right end.
Key standout values or extremes
Across panels, willingness sits near 90 percent or above for the shortest delivery windows and then sinks toward roughly 30 to 45 percent by the longest waits. Household consumables and health and beauty finish among the lowest end points, while fashion and household durables retain somewhat higher willingness before the final drop.
Controls / sequence, when applicable
This is a static chart image with no in-chart controls to operate.
Companion media, when applicable
There is no separate companion audio or video; the chart image is the full visual on this page.