Source page: McKinsey & Company
Commentary
The new age of geoeconomics
Geopolitics | Strategy
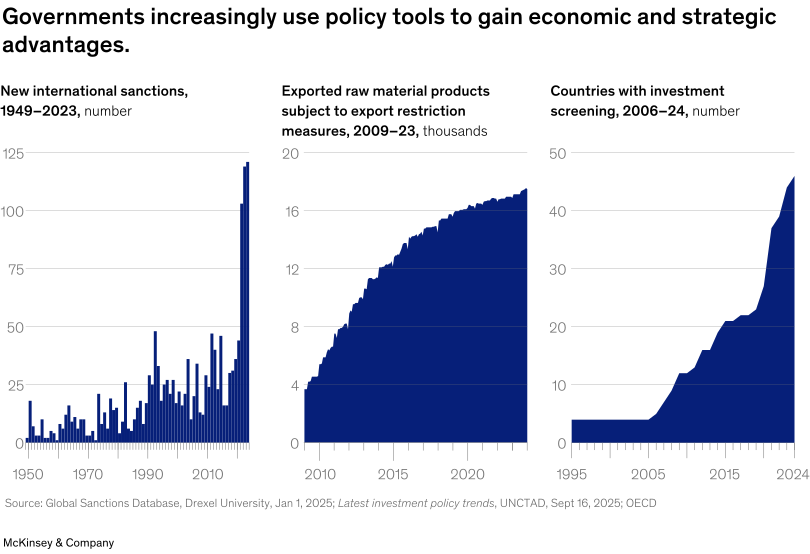
November 24, 2025 – Governments are increasingly using policy tools, such as sanctions, to gain economic and strategic advantages. While sanctions have been deployed for decades, their use has more than tripled since 2019, underscoring the rapid rise of geoeconomic tools, note Partners Robin Nuttall and Ziad Haider. Restrictions on exports of raw materials used in cutting-edge technologies, such as quantum computing and semiconductors, increased fivefold from 2009 to 2023. Countries are also increasingly using investment screening, with the number of instances rising ninefold since 2025. Companies that focus on strong corporate affairs capabilities may more easily navigate policy and regulatory changes, rather than simply be shaped by them.
To read the article, see “Upgrading corporate affairs for a new geopolitical era,” October 8, 2025.
customizer here
Visual form
Three-panel policy-intensity chart sequence combining a bar chart on the left with filled step-style time-series panels in the middle and on the right.
Layout / body structure
The visual is laid out as three side-by-side panels that read left to right: sanctions first, export restrictions second, and investment screening third, with a shared headline above and source notes below the full row.
What is being compared
It compares three different government policy tools over time: the annual number of new international sanctions, the number of exported raw-material products subject to export restriction measures, and the number of countries using investment-screening regimes.
Measurement system
The left and right panels use counts, while the middle panel is measured in thousands of products. Each panel has its own horizontal time scale and a vertical numeric scale, so the reader tracks how each policy measure rises over its own period rather than comparing unlike units directly.
Visible structure inside the graphic
The sanctions panel uses a dense run of vertical bars from 1949 to 2023. The export-restrictions panel is drawn as a dark filled shape that steps upward from 2009 to 2023. The investment-screening panel is another filled rising shape that climbs from a flat early base to a much higher level by 2024.
Main takeaway from the visual
All three panels trend upward, showing that governments are using sanctions, export controls, and investment screening more aggressively and more often than before.
Key standout values or extremes
The sanctions series climbs to roughly 120 new sanctions by 2023, export-restricted raw-material products rise from about 4 thousand to roughly 17 thousand between 2009 and 2023, and countries with investment screening increase from about 4 to about 46 between 2006 and 2024.
Controls / sequence, when applicable
This is a static chart image with no in-chart controls to operate.
Companion media, when applicable
There is no separate companion audio or video; the chart image is the full visual on this page.