Source page: McKinsey & Company
Commentary
The old one-two: Banks could lose $3.7 trillion in revenue over five years
Banking | COVID-19 | Financial services
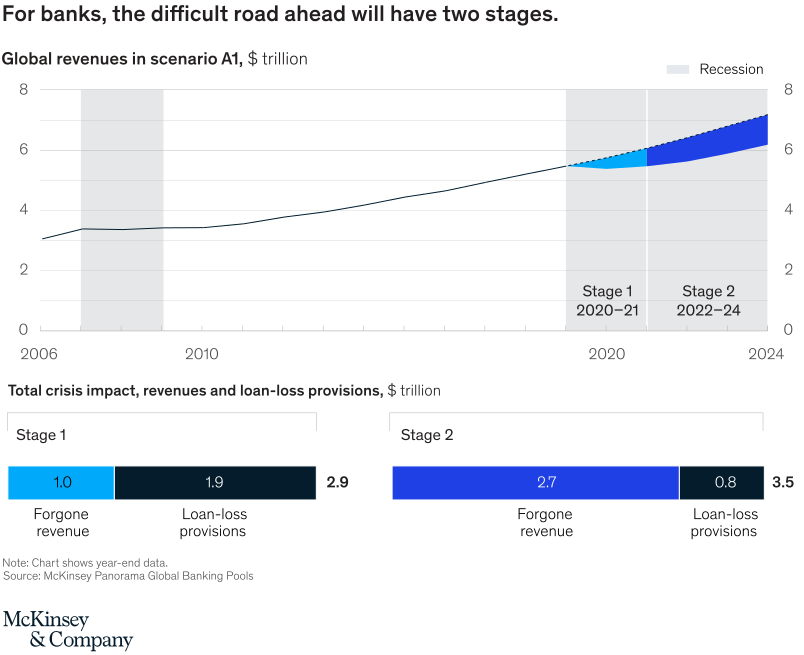
January 19, 2021 – The COVID-19 crisis will present a two-stage problem for banks. First will come severe credit losses, likely through late 2021. Then, amid a muted global recovery, banks will face a profound challenge to ongoing operations that may persist through 2024, or beyond. In our base-case scenario, $3.7 trillion of revenue will be forgone over five years.
To read the report, see “McKinsey’s Global Banking Annual Review,” December 9, 2020.
customizer here
Visual form
Two-part stage comparison chart.
Layout / body structure
The chart is split into an upper time-series panel and a lower pair of stacked comparison bars. Read the top panel first to see the recession period and the two labeled stages from 2020 through 2024, then move down to the bottom bars to compare the composition of total crisis impact in Stage 1 and Stage 2.
What is being compared
The chart compares global banking revenues under scenario A1 across time and then breaks the crisis impact into forgone revenue and loan-loss provisions for two separate stages. It is both a stage-over-time view and a composition-by-stage comparison.
Measurement system
The measurement is trillions of dollars. The top panel uses a revenue scale over time, while the bottom uses stacked horizontal bars with printed segment values and stage totals.
Visible structure inside the graphic
The top chart shows a black revenue line running from 2006 to 2024 across shaded recession windows, with Stage 1 and Stage 2 marked over the latest period. Below it, Stage 1 and Stage 2 each have a stacked bar: light blue and dark navy segments for forgone revenue and loan-loss provisions, with total figures printed at the right edge of each bar.
Main takeaway from the visual
The chart argues that the banking shock arrives in two different waves rather than one single hit, and the second stage is larger overall because revenue pressure dominates more heavily later on. The bottom bars make that progression clear by showing Stage 2 exceeding Stage 1 in total impact.
Key standout values or extremes
Stage 1 totals 2.9 trillion dollars, made up of 1.0 trillion in forgone revenue and 1.9 trillion in loan-loss provisions. Stage 2 totals 3.5 trillion dollars, made up of 2.7 trillion in forgone revenue and 0.8 trillion in loan-loss provisions, making it the larger of the two stages.
Controls / sequence, when applicable
This is a static chart image with no in-chart controls to operate.
Companion media, when applicable
There is no separate companion audio or video; the chart image is the full visual on this page.