Source page: McKinsey & Company
Commentary
The physician talent crisis
Healthcare | Talent
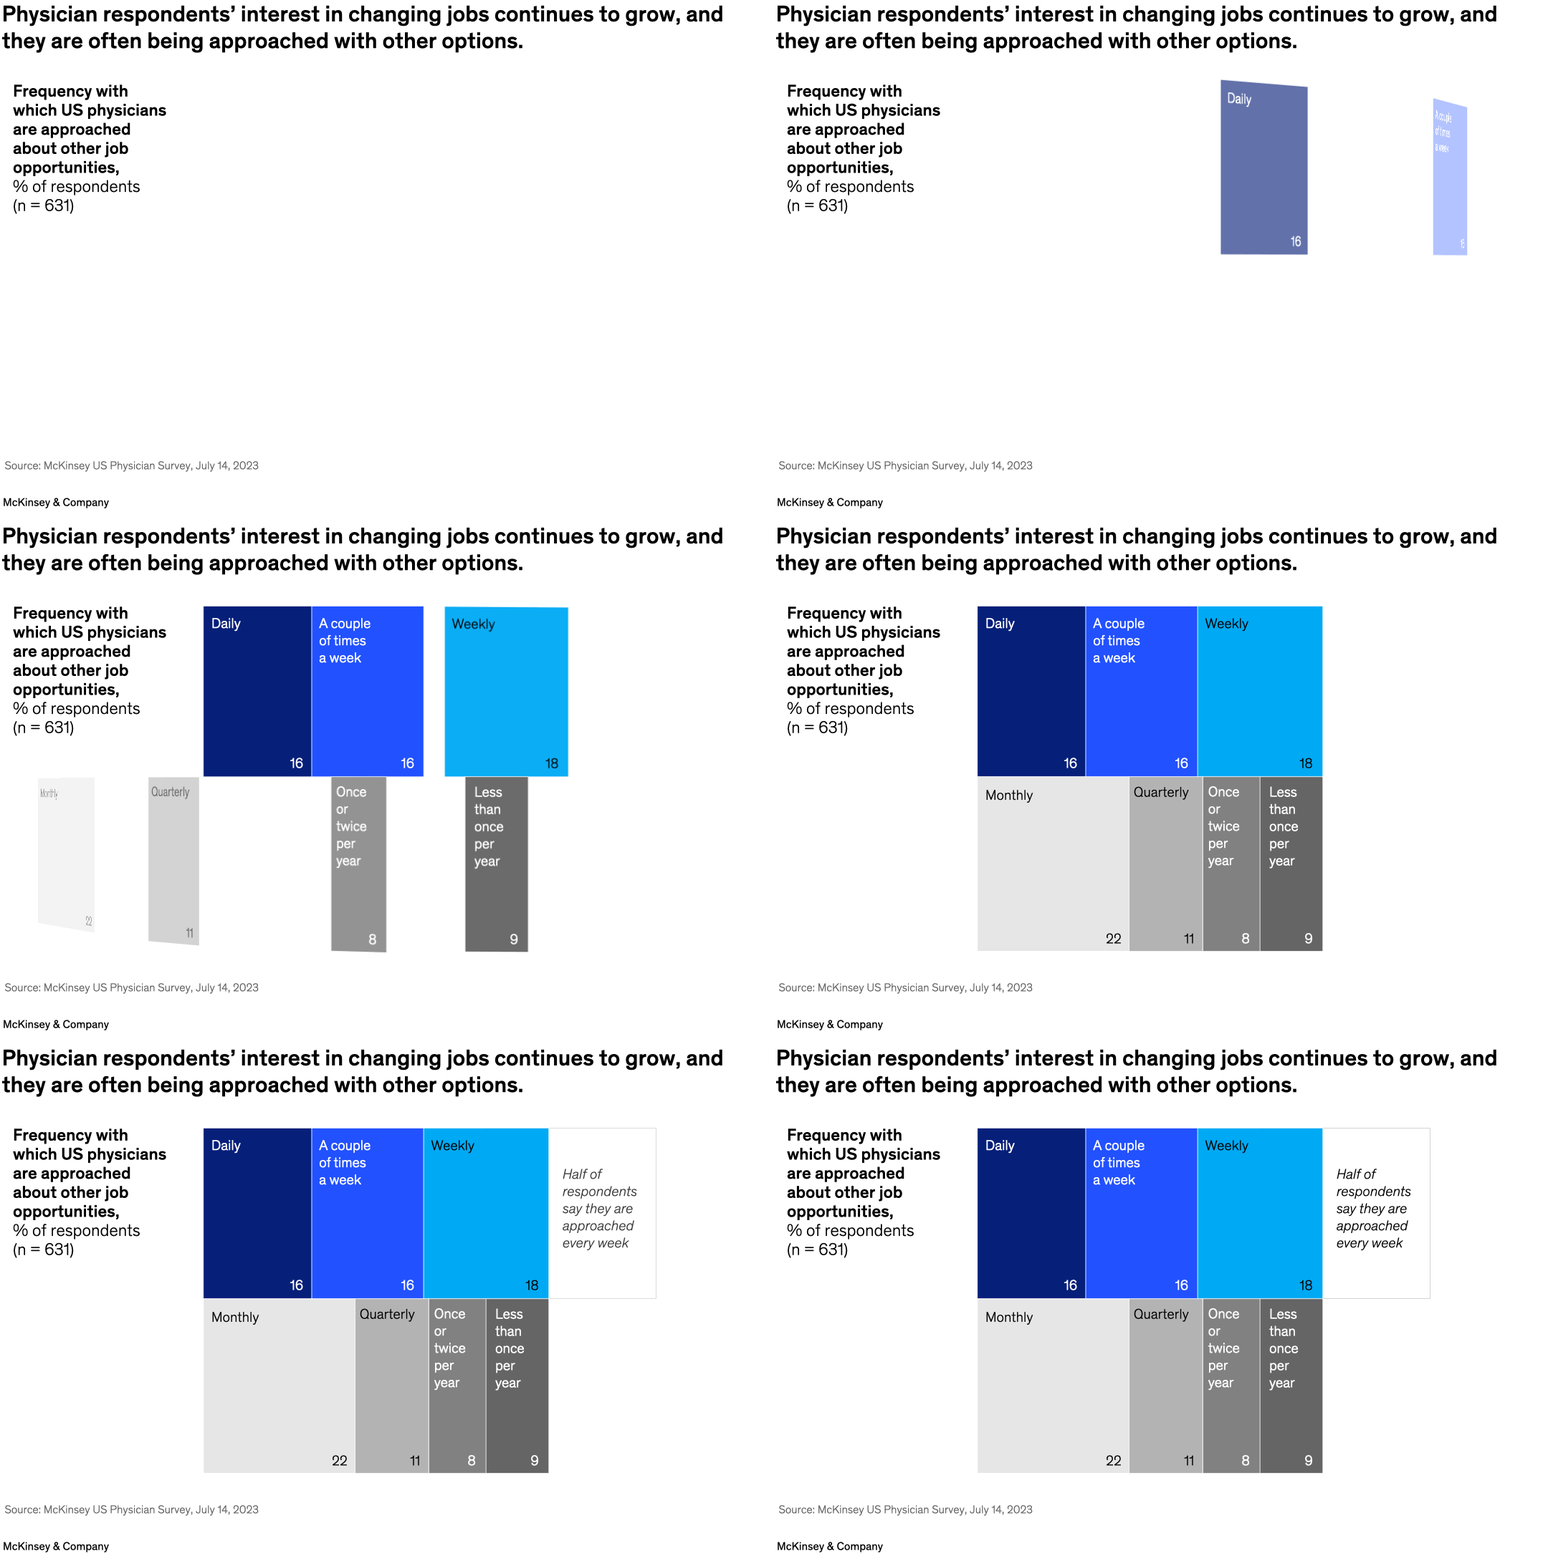
October 24, 2024 – Healthcare organizations are grappling with the increasingly difficult—and urgent—task of attracting and retaining physician talent to meet increasing patient demand for care. Turnover is likely to keep going up, and physicians are acutely aware that they have other job opportunities, say senior partner Rupal Malani and coauthors based on a McKinsey survey of US physicians. Seventy-two percent of respondents report they are approached about alternative job offers at least monthly, and 50 percent report being approached at least weekly.
To read the article, see “The physician shortage isn’t going anywhere,” September 10, 2024.
customizer here
Visual form
Treemap-style frequency chart.
Layout / body structure
The chart is a single block of rectangles sized by response share, with the categories arranged together inside one larger frame. Read the largest rectangles first and then compare the smaller blocks below and to the right to see how often physicians are approached about other job opportunities.
What is being compared
It compares the frequency with which US physicians are approached about other job opportunities. The categories shown are daily, a couple of times a week, weekly, monthly, quarterly, once or twice per year, and less than once per year.
Measurement system
Each block is measured as a percentage of respondents, and the values are printed inside the rectangles. Rectangle area and label size communicate which frequencies account for larger or smaller shares of the physician sample.
Visible structure inside the graphic
The visual is built from a set of labeled rectangles, with the largest monthly block spanning the lower-left portion and three prominent upper blocks for daily, a couple of times a week, and weekly. Smaller gray blocks on the lower right represent less frequent contact categories, and a right-side annotation highlights the combined weekly-or-more share.
Main takeaway from the visual
The visual shows that physician recruiting pressure is intense and frequent rather than occasional. Large blocks for daily, a couple of times a week, and weekly dominate much of the treemap, and the side note explicitly says that half of respondents are approached every week.
Key standout values or extremes
Monthly is the single largest category at 22 percent, while weekly is 18 percent and both daily and a couple of times a week are 16 percent each. Those three weekly-or-more categories sum to 50 percent, which is the central callout of the chart, while the less frequent categories are smaller at 11 percent quarterly, 8 percent once or twice per year, and 9 percent less than once per year.
Controls / sequence, when applicable
This is a static chart image with no in-chart controls to operate.
Companion media, when applicable
There is no separate companion audio or video; the chart image is the full visual on this page.