Source page: McKinsey & Company
Commentary
The ship has sailed but many US shoppers won’t wait
North America | Retail | Supply Chain Management
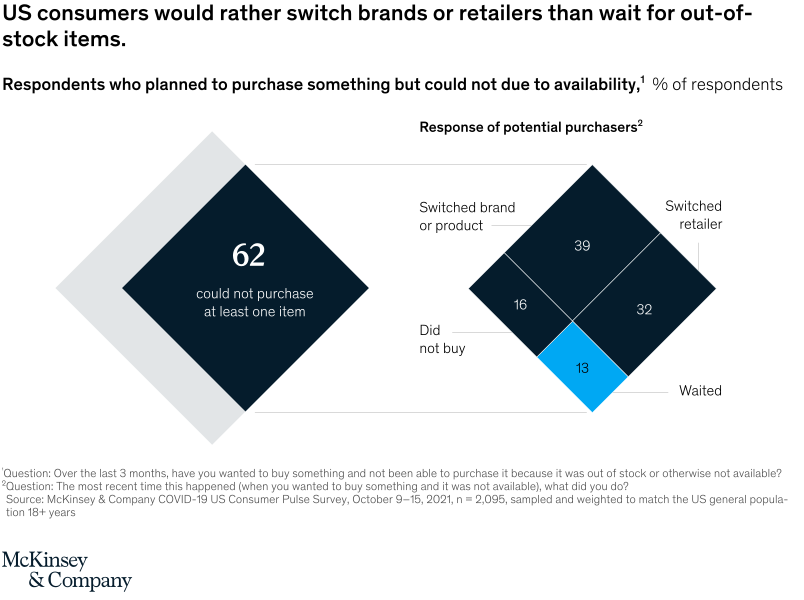
November 26, 2021 – As supply-chain woes persist, retailers are faced with waning customer loyalty this holiday season. Our recent COVID-19 US Consumer Pulse Survey unveiled that rather than wait for a replenishment of an out-of-stock item, 39 percent of respondents said they switched brands, while 32 percent went to another retailer.
To read the article, see “US holiday shopping 2021: Strong demand meets big challenges,” November 2, 2021.
customizer here
Visual form
Two-diamond decision chart.
Layout / body structure
The chart is split into two large diamond-shaped graphics. The left diamond shows the share of respondents who could not purchase at least one item, and the right diamond breaks that subgroup into four response outcomes, so the reader moves from the high-level incidence figure into the action mix that follows stockouts.
What is being compared
The chart compares two related things: how many consumers encountered unavailable items and how those consumers responded. The response diamond then compares switching brand or product, switching retailer, waiting, and not buying.
Measurement system
The measurement is percent of respondents. The left diamond centers a single 62 percent figure, while the right segmented diamond assigns 39, 32, 13, and 16 percent to the four behavioral responses among potential purchasers who ran into availability problems.
Visible structure inside the graphic
On the left, a dark inner diamond sits inside a pale outer diamond and carries the large 62 figure with the caption could not purchase at least one item. On the right, the second diamond is partitioned into four triangular sectors, with the largest top sector labeled 39 for switched brand or product, the right sector 32 for switched retailer, the small blue bottom sector 13 for waited, and the left sector 16 for did not buy.
Main takeaway from the visual
When shoppers encounter out-of-stock items, most do not wait; they switch brands or retailers instead. The right-hand diamond makes that tradeoff visible because the switching sectors occupy most of the shape, while the waiting segment is the smallest labeled response.
Key standout values or extremes
The headline incidence figure is 62 percent of respondents who could not purchase at least one item. Within the response breakdown, switching brand or product is highest at 39 percent, switching retailer follows at 32 percent, did not buy is 16 percent, and waited is lowest at 13 percent.
Controls / sequence, when applicable
This is a static chart image with no in-chart controls to operate.
Companion media, when applicable
There is no separate companion audio or video; the chart image is the full visual on this page.