Source page: McKinsey & Company
Commentary
The value of net zero
Sustainability | Technology
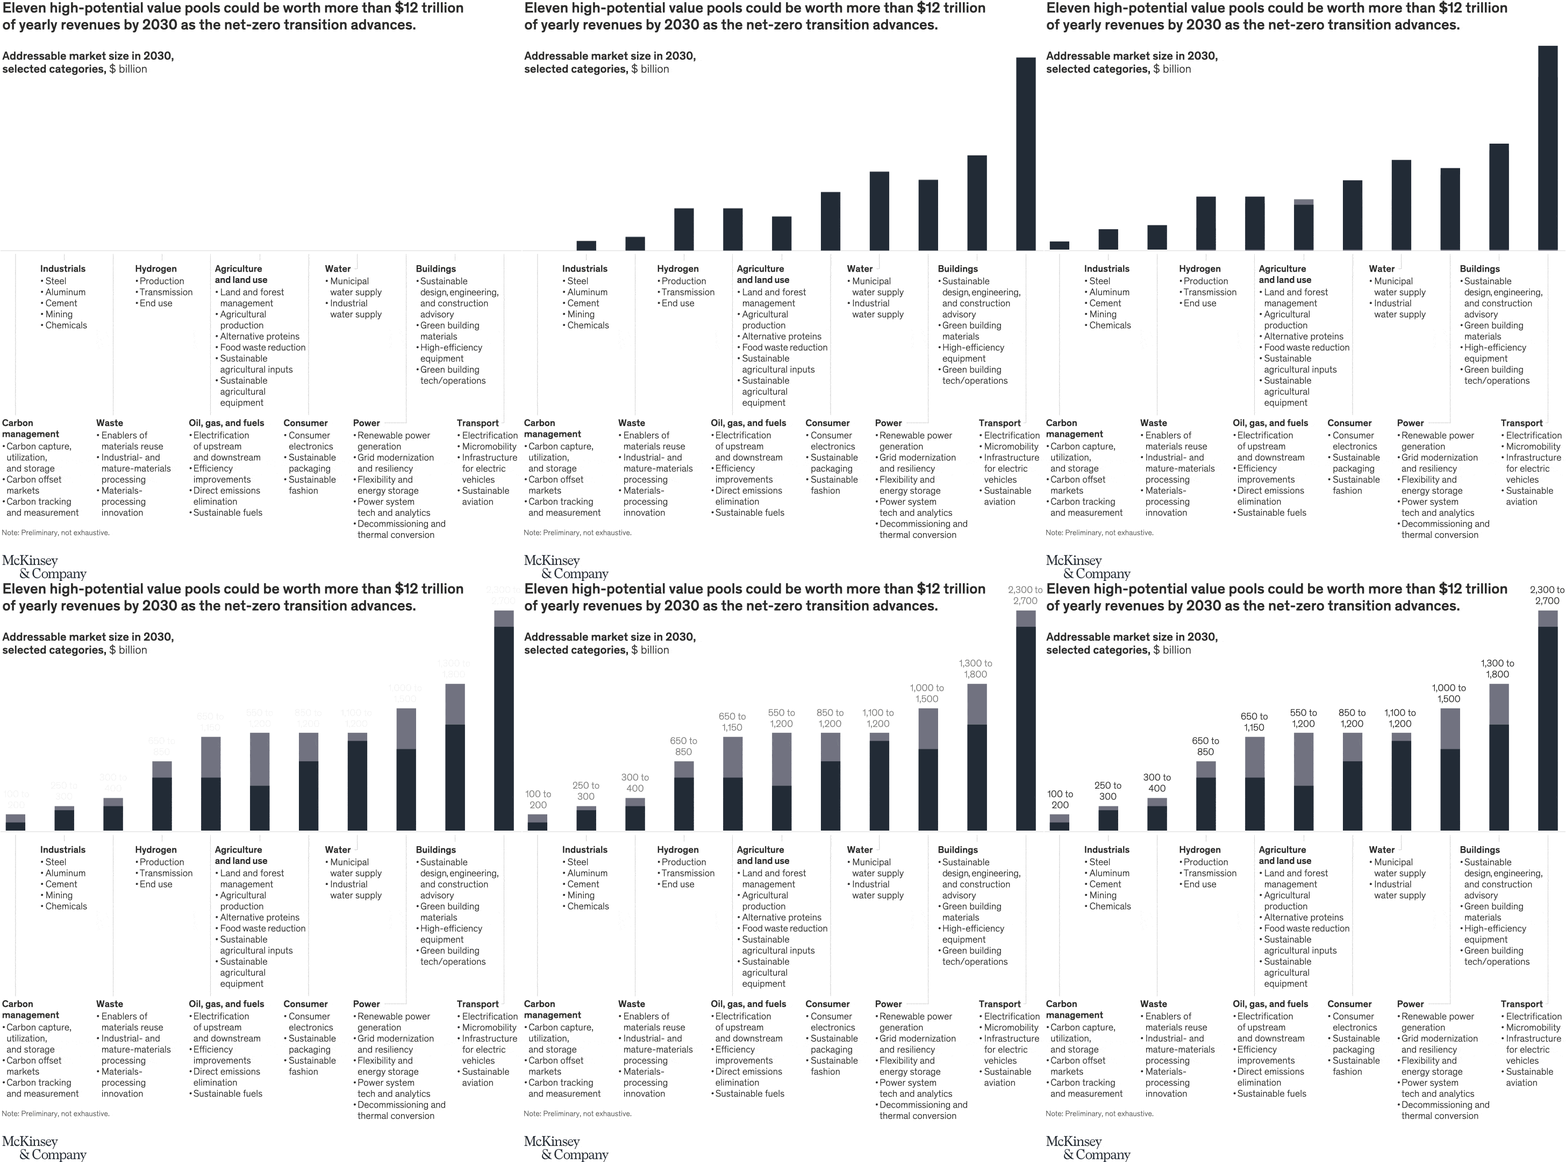
August 29, 2022 – Demand for green products and services is growing strongly in categories such as energy and materials, vehicles, food, and packaging. As the net-zero transition advances, markets for low-emissions offerings are expected to expand further while markets for emissions-intensive offerings shrink. We estimate that burgeoning demand for net-zero offerings could create unprecedented opportunities: 11 value pools could generate up to more than $12 trillion of annual sales by 2030.
To read the article, see “Accelerating toward net zero: The green business building opportunity,” June 14, 2022.
customizer here
Visual form
A vertical range column chart with 11 sector bars.
Layout / body structure
The chart is a single wide chart read left to right. Eleven columns run across the top half of the page, each with a low-to-high revenue range printed above it, while the bottom half lists the named sector and example subcategories aligned under each column.
What is being compared
The chart compares eleven net-zero value pools by their addressable market size in 2030. It places sectors such as carbon management, hydrogen, power, buildings, and transport on the same scale so the reader can see which opportunity pools are smallest, mid-sized, and largest.
Measurement system
The measurement is addressable market size in 2030 in billions of dollars. Each bar shows a lower estimate in the dark segment and an upper extension in gray, with the printed range above each column giving the full revenue interval for that value pool.
Visible structure inside the graphic
From left to right the columns are Carbon management, Industrials, Waste, Hydrogen, Oil, gas, and fuels, Agriculture and land use, Consumer, Water, Power, Buildings, and Transport. The bars rise sharply toward the right side of the chart, and the labels below each one spell out the component businesses, such as carbon capture and offsets under carbon management, renewable power and grid modernization under power, and electrification and sustainable aviation under transport.
Main takeaway from the visual
The visual shows that the net-zero transition is not one isolated market but a ladder of large revenue pools spread across many sectors, with the biggest opportunities concentrated in transport, buildings, and power. The steady rise in bar height across the chart makes it clear that several pools can individually reach the trillion-dollar range by 2030.
Key standout values or extremes
The smallest pool shown is carbon management at $100 billion to $200 billion, while the largest is transport at $2.3 trillion to $2.7 trillion. Other standout ranges are buildings at $1.3 trillion to $1.8 trillion, power at $1.0 trillion to $1.5 trillion, consumer at $850 billion to $1.2 trillion, and water at $1.1 trillion to $1.2 trillion.
Controls / sequence, when applicable
This is a static chart image with no in-chart controls to operate.
Companion media, when applicable
There is no separate companion audio or video; the chart image is the full visual on this page.