Source page: McKinsey & Company
Commentary
The world goes online
Digital | Technology
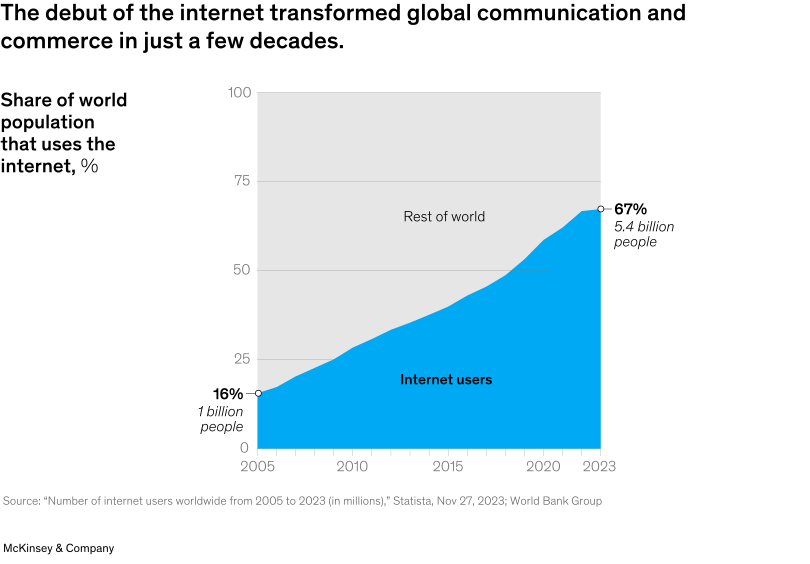
December 19, 2024 – In the decades since the World Wide Web debuted in 1991, internet usage has grown dramatically, transforming global communication and commerce. In 2005, only 16 percent of the world’s population, about one billion people, used the internet. By 2023, internet users had expanded to 67 percent of the global population. As McKinsey Quarterly marks its 60th birthday, it explores this and 24 other technology breakthroughs that have transformed business, from the foundation of modern computing in the 1960s to commercial space exploration just a few years ago.
To explore the interactive, see “Sixty years of innovation: Key moments in business technology,” October 2024.
customizer here
Visual form
Single area chart.
Layout / body structure
The chart is one clean area chart running from 2005 to 2023. Read left to right along the time axis, comparing the expanding blue area of internet users against the shrinking gray remainder labeled as the rest of world.
What is being compared
It compares the share of the world population that uses the internet against the share that does not. The chart is focused on how quickly global internet adoption expanded over less than two decades.
Measurement system
The vertical axis is measured in percent of world population, and the line endpoints are annotated with both percentages and approximate people counts. The blue filled area represents internet users, while the gray upper area represents the remaining nonuser share.
Visible structure inside the graphic
The chart is organized as a rising blue filled area beneath a simple trend line, with annotations at the start and end points. The shaded split between blue and gray makes the internet-user share and the nonuser remainder readable as parts of one 100 percent total.
Main takeaway from the visual
The visual shows that internet adoption moved from a minority share of the world population to a solid global majority in a relatively short time. The blue area expands steadily and then more sharply, reaching about two-thirds of the world by the endpoint.
Key standout values or extremes
The chart starts at 16 percent in 2005, labeled as about 1 billion people, and rises to 67 percent in 2023, labeled as about 5.4 billion people. That end state leaves only about one-third of the world in the gray remainder by 2023.
Controls / sequence, when applicable
This is a static chart image with no in-chart controls to operate.
Companion media, when applicable
There is no separate companion audio or video; the chart image is the full visual on this page.