Source page: McKinsey & Company
Commentary
There are recoveries, and then there are recoveries
COVID-19 | Economy | Productivity
April 13, 2021 – If business and consumers are cautious and innovation is subdued, the postpandemic recovery could look similar to the sluggish decade after the global financial crisis. But if businesses invest, consumers buy, and innovation sizzles, a fast economic renewal more akin to the postwar years could be at hand.
To read the report, see “Will productivity and growth return after the COVID-19 crisis?,” March 30, 2021.
customizer here
Visual form
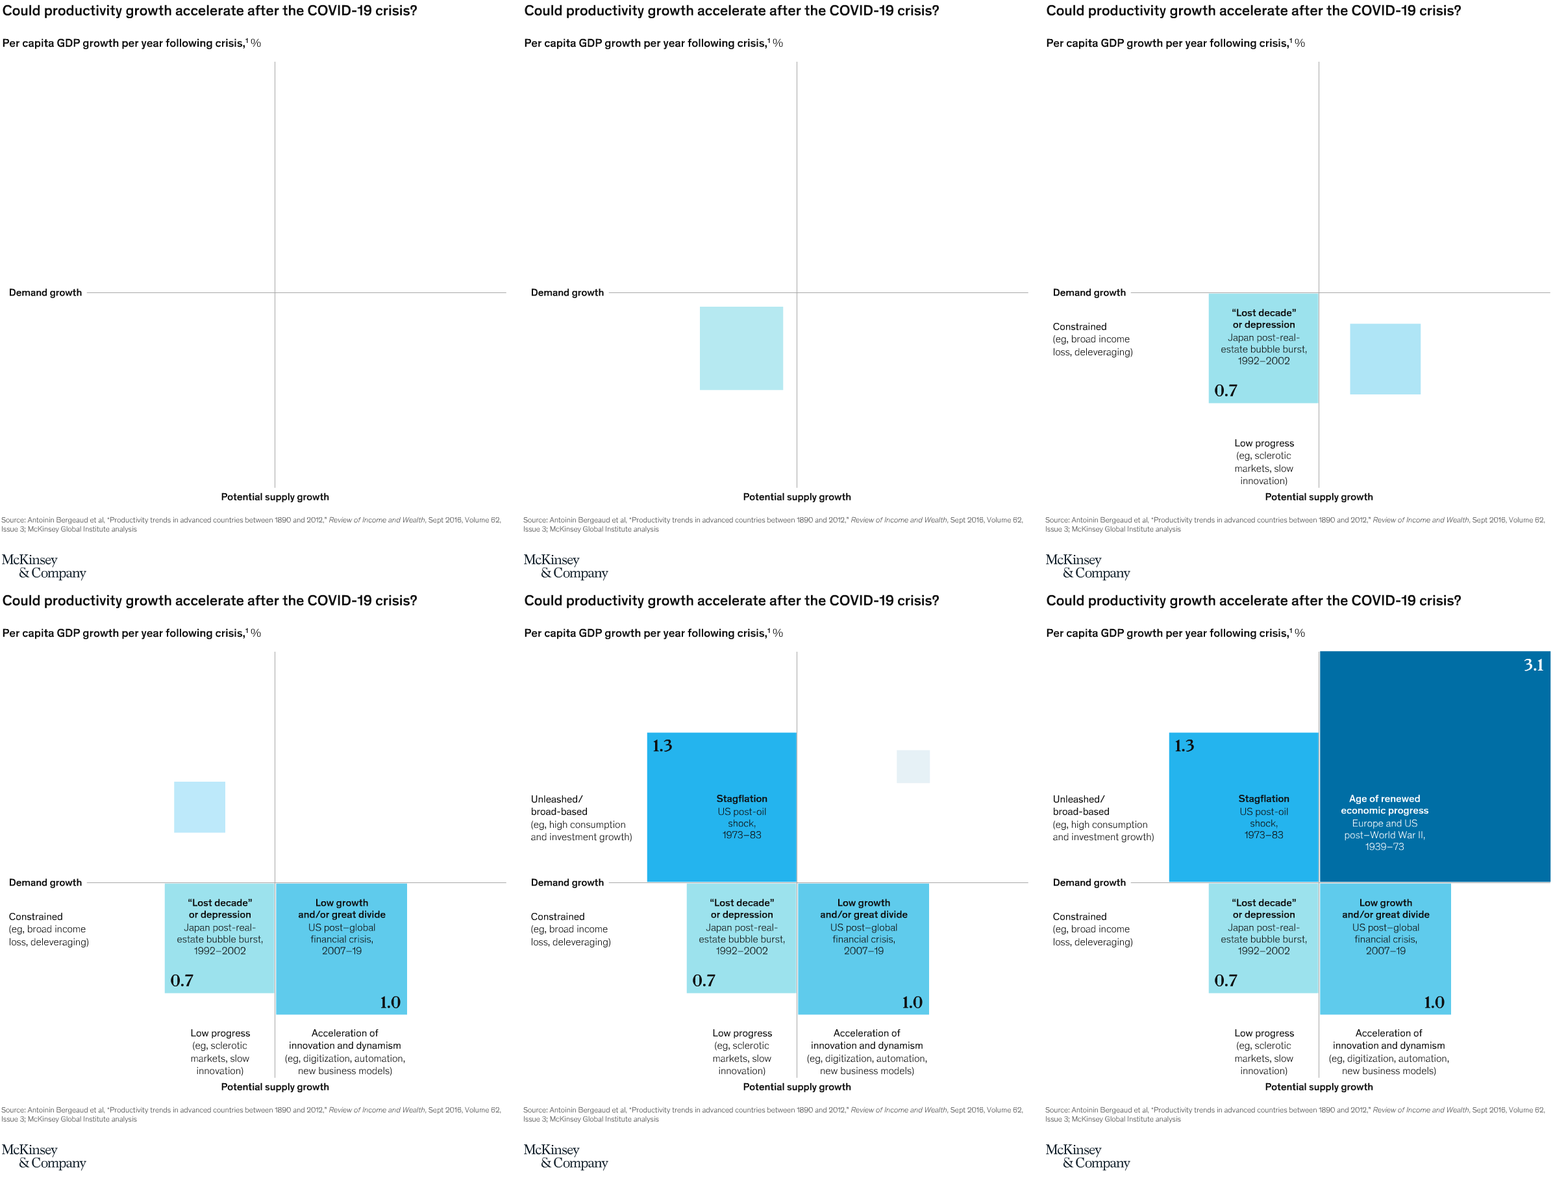
Four-quadrant block chart.
Layout / body structure
The chart divides the page into four labeled quadrants around a central cross of demand growth and potential supply growth. Reader first orients to the two axes, then compares the size and placement of the four colored blocks that occupy the quadrants.
What is being compared
It compares four styles of post-crisis productivity environments by combining two demand conditions, constrained versus unleashed demand growth, with two supply conditions, low progress versus acceleration of innovation and dynamism.
Measurement system
The values are annual per capita GDP growth rates following crisis, shown directly as 0.7, 1.0, 1.3, and 3.1 percent inside the four quadrant blocks. Position in the frame communicates the demand and supply regime, while block size and printed numbers anchor the growth outcome.
Visible structure inside the graphic
Each quadrant contains a large colored rectangle with a scenario name and a historical example: a small lower-left block for lost decade or depression, a lower-right block for low growth and divide, an upper-left block for stagflation, and a dominant upper-right block for age of renewed economic progress. The upper-right rectangle is visibly the largest and darkest shape on the page, which immediately draws the eye.
Main takeaway from the visual
The strongest productivity outcome comes from the combination of unleashed demand and accelerated innovation, while constrained demand and slow progress produce the weakest growth. The chart makes that contrast feel dramatic because the upper-right block towers over the others with the highest printed value.
Key standout values or extremes
The upper-right age-of-renewed-economic-progress quadrant is labeled 3.1 percent, the highest value on the chart. Stagflation in the upper-left is 1.3 percent, low growth and divide in the lower-right is 1.0 percent, and the lower-left lost decade or depression scenario is the smallest at 0.7 percent.
Controls / sequence, when applicable
This is a static chart image with no in-chart controls to operate.
Companion media, when applicable
There is no separate companion audio or video; the chart image is the full visual on this page.